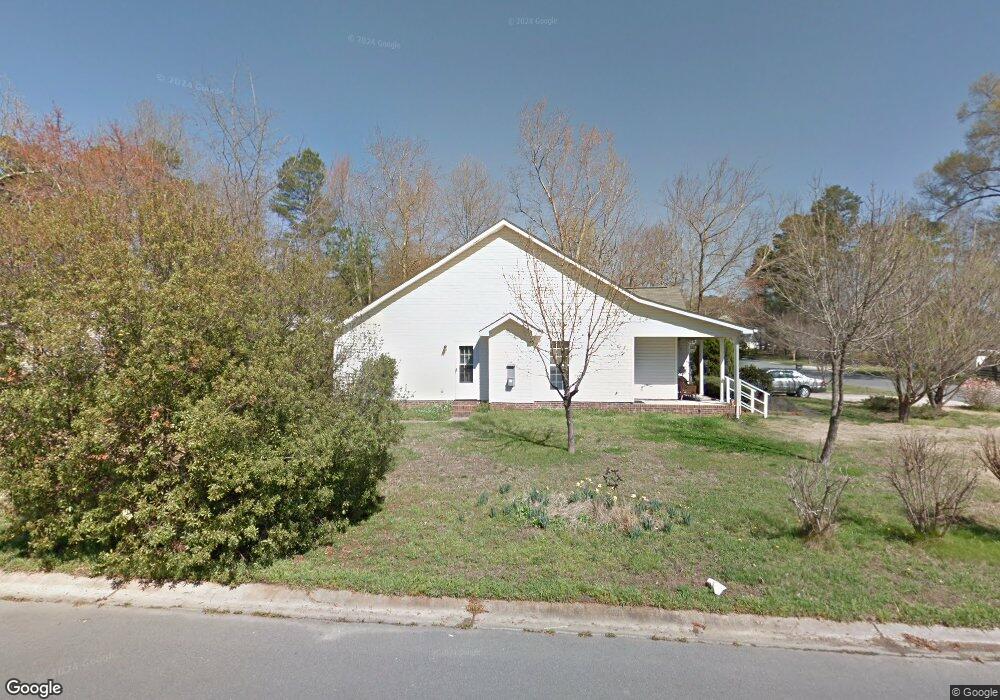
2005 Pine Pointe St Matthews, NC 28104
Estimated Value: $327,000 - $361,000
Studio
2
Baths
1,264
Sq Ft
$275/Sq Ft
Est. Value
About This Home
This home is located at 2005 Pine Pointe St, Matthews, NC 28104 and is currently estimated at $347,326, approximately $274 per square foot. 2005 Pine Pointe St is a home located in Union County with nearby schools including Indian Trail Elementary School, Sun Valley Middle School, and Sun Valley High School.
Ownership History
Date
Name
Owned For
Owner Type
Purchase Details
Closed on
Aug 6, 2020
Sold by
Trew Lucinda A and Tippett Jeffrey E
Bought by
Bowman Erin Marie
Current Estimated Value
Home Financials for this Owner
Home Financials are based on the most recent Mortgage that was taken out on this home.
Original Mortgage
$196,314
Outstanding Balance
$173,690
Interest Rate
3.1%
Mortgage Type
New Conventional
Estimated Equity
$173,636
Purchase Details
Closed on
Jan 19, 2017
Sold by
Trew Lucinda A
Bought by
Trew Lucinda A and Tippett Jeffrey E
Purchase Details
Closed on
Feb 26, 1999
Sold by
Lewis Homes Inc
Bought by
Trew Joan
Home Financials for this Owner
Home Financials are based on the most recent Mortgage that was taken out on this home.
Original Mortgage
$123,916
Interest Rate
6.84%
Mortgage Type
FHA
Create a Home Valuation Report for This Property
The Home Valuation Report is an in-depth analysis detailing your home's value as well as a comparison with similar homes in the area
Purchase History
| Date | Buyer | Sale Price | Title Company |
|---|---|---|---|
| Bowman Erin Marie | $218,500 | None Available | |
| Trew Lucinda A | -- | None Available | |
| Trew Joan | $124,500 | -- |
Source: Public Records
Mortgage History
| Date | Status | Borrower | Loan Amount |
|---|---|---|---|
| Open | Bowman Erin Marie | $196,314 | |
| Previous Owner | Trew Joan | $123,916 |
Source: Public Records
Tax History
| Year | Tax Paid | Tax Assessment Tax Assessment Total Assessment is a certain percentage of the fair market value that is determined by local assessors to be the total taxable value of land and additions on the property. | Land | Improvement |
|---|---|---|---|---|
| 2025 | $2,344 | $340,100 | $0 | $0 |
| 2024 | $2,048 | $231,000 | $43,500 | $187,500 |
| 2023 | $1,965 | $231,000 | $43,500 | $187,500 |
| 2022 | $1,944 | $231,000 | $43,500 | $187,500 |
| 2021 | $1,943 | $231,000 | $43,500 | $187,500 |
| 2020 | $1,601 | $156,100 | $28,000 | $128,100 |
| 2019 | $1,601 | $156,100 | $28,000 | $128,100 |
| 2018 | $1,601 | $156,100 | $28,000 | $128,100 |
| 2017 | $1,633 | $156,100 | $28,000 | $128,100 |
| 2016 | $1,657 | $156,100 | $28,000 | $128,100 |
| 2015 | $860 | $156,100 | $28,000 | $128,100 |
| 2014 | $511 | $144,420 | $30,000 | $114,420 |
Source: Public Records
Map
Nearby Homes
- 136 Balboa St
- 2080 Gable Way Ln
- 2020 Gable Way Ln
- 124 Clydesdale Ct
- 6008 Brookfield Ct
- 2006 Laney Pond Rd
- 5054 Stonehill Ln
- 3823 Wonderland Dr
- 2034 Laney Pond Rd
- 1441 Hammond Dr
- 700 Chestnut Ln
- 224 Azteca Dr
- 1103 Clover Ln
- 1038 Kensrowe Ln
- 1008 Irvine Ct
- 1348 Millbank Dr
- 2241 Indian Cross Trail
- 0000 Chestnut Ln
- 230 Quinn Rd
- 226 Quinn Rd
- 2013 Pine Pointe St
- 1033 Slate Ridge Rd
- 2021 Pine Pointe St
- 1048 Slate Ridge Rd
- 4009 Maple Shore Dr
- 4009 Maple Shore Dr
- 1025 Slate Ridge Rd
- 1102 Slate Ridge Rd
- 1032 Slate Ridge Rd
- 2012 Pine Pointe St
- 4017 Maple Shore Dr
- 1110 Slate Ridge Rd
- 1111 Slate Ridge Rd
- 1024 Slate Ridge Rd
- 1017 Slate Ridge Rd
- 4025 Maple Shore Dr
- 4002 Maple Shore Dr
- 5043 Weatherly Way
- 1118 Slate Ridge Rd
- 1119 Slate Ridge Rd
Your Personal Tour Guide
Ask me questions while you tour the home.