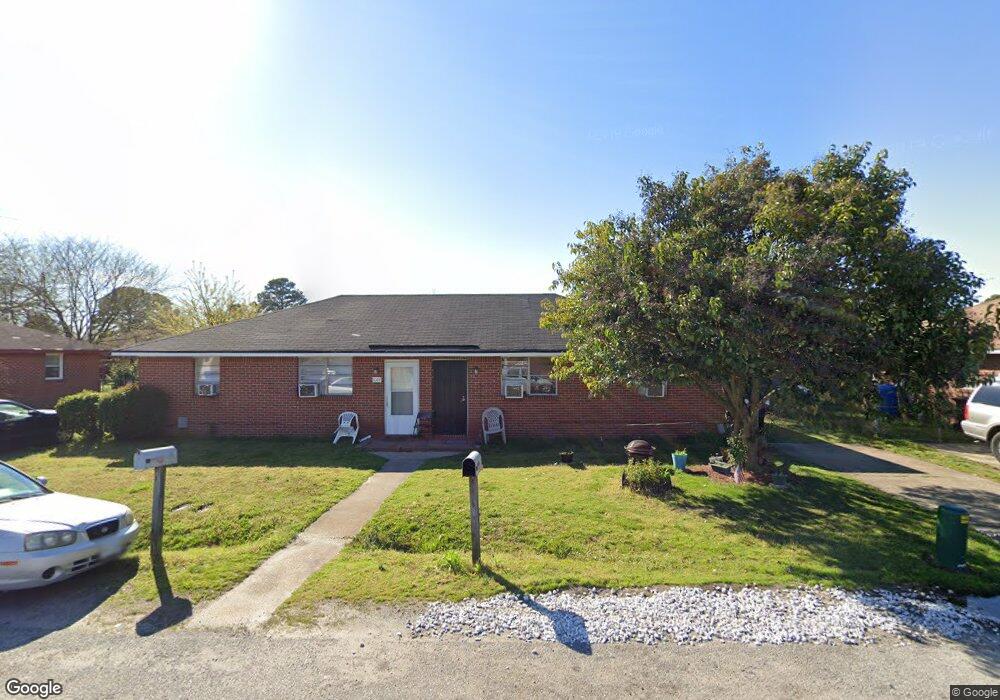
2005 Pond Ln Chesapeake, VA 23324
Indian River NeighborhoodEstimated Value: $199,000 - $236,734
4
Beds
2
Baths
1,624
Sq Ft
$136/Sq Ft
Est. Value
About This Home
This home is located at 2005 Pond Ln, Chesapeake, VA 23324 and is currently estimated at $220,934, approximately $136 per square foot. 2005 Pond Ln is a home located in Chesapeake City with nearby schools including Thurgood Marshall Elementary School, Oscar Smith Middle School, and Oscar F Smith High.
Ownership History
Date
Name
Owned For
Owner Type
Purchase Details
Closed on
May 21, 2003
Sold by
Chesapeake Dev
Bought by
Oldham Tony
Current Estimated Value
Home Financials for this Owner
Home Financials are based on the most recent Mortgage that was taken out on this home.
Original Mortgage
$73,400
Outstanding Balance
$32,064
Interest Rate
5.86%
Mortgage Type
Commercial
Estimated Equity
$188,870
Purchase Details
Closed on
Jun 26, 2002
Sold by
Commonwealth Asset Servs
Bought by
United Pan Am Mrtg Loan Trust
Create a Home Valuation Report for This Property
The Home Valuation Report is an in-depth analysis detailing your home's value as well as a comparison with similar homes in the area
Home Values in the Area
Average Home Value in this Area
Purchase History
| Date | Buyer | Sale Price | Title Company |
|---|---|---|---|
| Oldham Tony | $82,000 | -- | |
| United Pan Am Mrtg Loan Trust | $495,000 | -- |
Source: Public Records
Mortgage History
| Date | Status | Borrower | Loan Amount |
|---|---|---|---|
| Open | Oldham Tony | $73,400 |
Source: Public Records
Tax History
| Year | Tax Paid | Tax Assessment Tax Assessment Total Assessment is a certain percentage of the fair market value that is determined by local assessors to be the total taxable value of land and additions on the property. | Land | Improvement |
|---|---|---|---|---|
| 2025 | $1,842 | $185,600 | $90,000 | $95,600 |
| 2024 | $1,842 | $182,400 | $90,000 | $92,400 |
| 2023 | $1,506 | $171,400 | $80,000 | $91,400 |
| 2022 | $1,498 | $148,300 | $60,000 | $88,300 |
| 2021 | $1,296 | $123,400 | $50,000 | $73,400 |
| 2020 | $1,289 | $122,800 | $50,000 | $72,800 |
| 2019 | $1,289 | $122,800 | $50,000 | $72,800 |
| 2018 | $1,202 | $114,500 | $50,000 | $64,500 |
| 2017 | $1,181 | $112,500 | $50,000 | $62,500 |
| 2016 | $1,181 | $112,500 | $50,000 | $62,500 |
| 2015 | $1,181 | $112,500 | $50,000 | $62,500 |
| 2014 | $1,181 | $112,500 | $50,000 | $62,500 |
Source: Public Records
Map
Nearby Homes
Your Personal Tour Guide
Ask me questions while you tour the home.