
Seller's Agent in 2018
Crystal Commean
RE/MAX Professionals
(217) 685-9575
282 Total Sales

Estimated Value: $112,239 - $126,000
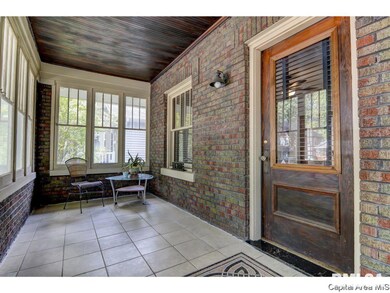
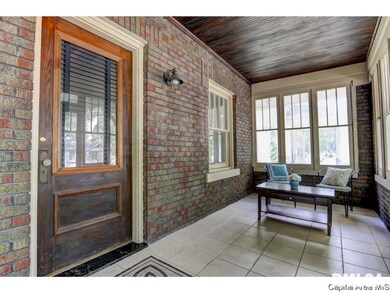
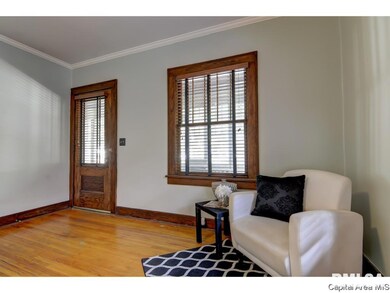
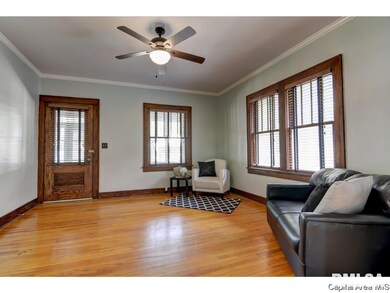
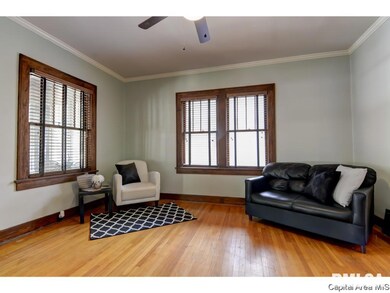
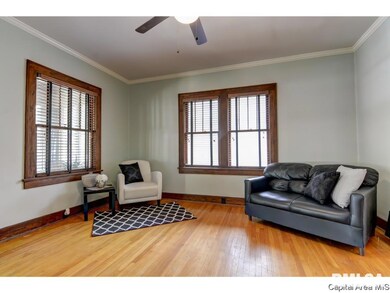
Beaming with charm & character! This pretty brick bungalow is super clean, freshly painted & move-in ready for her next lucky owner! Features 2 spacious bedrooms, 1 updated bath, original hardwoods/built-ins/fixtures, partially finished basement w/bonus room, 2 car detached garage, nice landscaping & privacy fenced backyard! All appliances are included, as is a Diamond package home warranty plan through Home Warranty of America!
Last Agent to Sell the Property
RE/MAX Professionals License #475161193 Listed on: 04/23/2018
| Date | Buyer | Sale Price | Title Company |
|---|---|---|---|
| Wilk Sarah M | $79,900 | Zelle Title | |
| -- | -- | -- | |
| -- | $81,300 | -- | |
| -- | $68,000 | -- | |
| -- | $52,000 | -- | |
| -- | -- | -- | |
| -- | -- | -- |
| Date | Status | Borrower | Loan Amount |
|---|---|---|---|
| Open | Wilk Sarah M | $74,124 |
| Date | Event | Price | List to Sale | Price per Sq Ft |
|---|---|---|---|---|
| 06/13/2018 06/13/18 | Sold | $79,900 | 0.0% | $71 / Sq Ft |
| 04/26/2018 04/26/18 | Pending | -- | -- | -- |
| 04/23/2018 04/23/18 | For Sale | $79,900 | -- | $71 / Sq Ft |
| Year | Tax Paid | Tax Assessment Tax Assessment Total Assessment is a certain percentage of the fair market value that is determined by local assessors to be the total taxable value of land and additions on the property. | Land | Improvement |
|---|---|---|---|---|
| 2024 | $2,475 | $35,470 | $5,397 | $30,073 |
| 2023 | $2,334 | $32,399 | $4,930 | $27,469 |
| 2022 | $2,216 | $30,734 | $4,677 | $26,057 |
| 2021 | $2,123 | $29,583 | $4,502 | $25,081 |
| 2020 | $2,081 | $29,628 | $4,509 | $25,119 |
| 2019 | $2,041 | $29,524 | $4,493 | $25,031 |
| 2018 | $1,773 | $26,982 | $4,471 | $22,511 |
| 2017 | $1,928 | $29,002 | $4,413 | $24,589 |
| 2016 | $1,883 | $28,579 | $4,349 | $24,230 |
| 2015 | $1,859 | $28,237 | $4,297 | $23,940 |
| 2014 | $1,770 | $28,054 | $4,269 | $23,785 |
| 2013 | $1,730 | $27,357 | $4,270 | $23,087 |
Seller's Agent in 2018
Crystal Commean
RE/MAX Professionals
(217) 685-9575
282 Total Sales
Buyer's Agent in 2018
Kim Wenda
RE/MAX Professionals
(217) 341-3555
500 Total Sales
Source: RMLS Alliance
MLS Number: RMACA182369
APN: 22-04.0-403-017
Disclaimer: Certain information contained herein is derived from information provided by parties other than Homes.com. All information provided is deemed reliable, but is not guaranteed to be accurate and should be independently verified.
![]() Based on information submitted to the MLS GRID. All data is obtained from various sources and may not have been verified by broker or MLS GRID. Supplied Open House Information is subject to change without notice. All information should be independently reviewed and verified for accuracy. Properties may or may not be listed by the office/agent presenting the information. Some IDX listings have been excluded from this website.IDX information is provided exclusively for personal, non-commercial use, and may not be used for any purpose other than to identify prospective properties consumers may be interested in purchasing. Information is deemed reliable but not guaranteed.
Based on information submitted to the MLS GRID. All data is obtained from various sources and may not have been verified by broker or MLS GRID. Supplied Open House Information is subject to change without notice. All information should be independently reviewed and verified for accuracy. Properties may or may not be listed by the office/agent presenting the information. Some IDX listings have been excluded from this website.IDX information is provided exclusively for personal, non-commercial use, and may not be used for any purpose other than to identify prospective properties consumers may be interested in purchasing. Information is deemed reliable but not guaranteed.
Based on information submitted to the MLS GRID
Ask me questions while you tour the home.