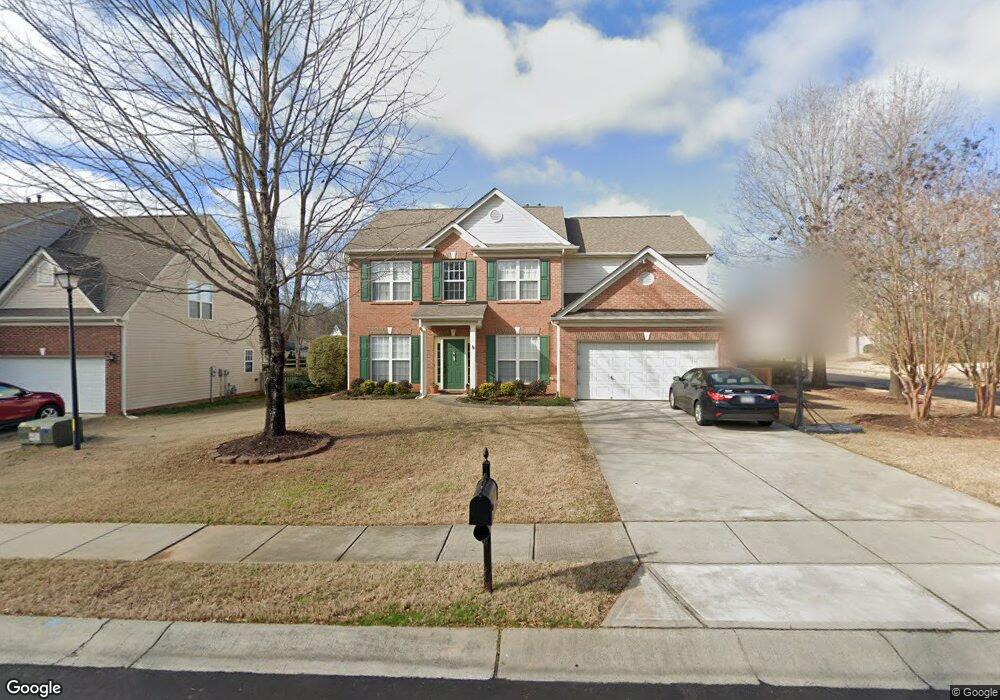
2005 Sandbox Cir Indian Trail, NC 28079
Estimated Value: $493,782 - $511,000
4
Beds
3
Baths
2,479
Sq Ft
$203/Sq Ft
Est. Value
About This Home
This home is located at 2005 Sandbox Cir, Indian Trail, NC 28079 and is currently estimated at $502,946, approximately $202 per square foot. 2005 Sandbox Cir is a home located in Union County with nearby schools including Indian Trail Elementary School, Sun Valley Middle School, and Sun Valley High School.
Ownership History
Date
Name
Owned For
Owner Type
Purchase Details
Closed on
Apr 29, 2009
Sold by
Jpmc Specialty Mortgage Llc
Bought by
Brown Peter E and Brown Rosilyn K
Current Estimated Value
Home Financials for this Owner
Home Financials are based on the most recent Mortgage that was taken out on this home.
Original Mortgage
$163,200
Outstanding Balance
$102,664
Interest Rate
5.01%
Mortgage Type
Unknown
Estimated Equity
$400,282
Purchase Details
Closed on
Sep 10, 2008
Sold by
Young Philip A and Young Patricia M
Bought by
Wm Specialty Mortgage Llc
Purchase Details
Closed on
Apr 11, 2003
Sold by
Lewis Homes Inc
Bought by
Young Philip A and Young Patricia M
Home Financials for this Owner
Home Financials are based on the most recent Mortgage that was taken out on this home.
Original Mortgage
$166,600
Interest Rate
9.12%
Purchase Details
Closed on
May 20, 2002
Sold by
Rdh Of Union Llc
Bought by
Lewis Homes Inc
Create a Home Valuation Report for This Property
The Home Valuation Report is an in-depth analysis detailing your home's value as well as a comparison with similar homes in the area
Purchase History
| Date | Buyer | Sale Price | Title Company |
|---|---|---|---|
| Brown Peter E | $192,000 | None Available | |
| Wm Specialty Mortgage Llc | $240,518 | None Available | |
| Young Philip A | $196,000 | -- | |
| Lewis Homes Inc | $174,000 | -- |
Source: Public Records
Mortgage History
| Date | Status | Borrower | Loan Amount |
|---|---|---|---|
| Open | Brown Peter E | $163,200 | |
| Previous Owner | Young Philip A | $166,600 | |
| Closed | Young Philip A | $29,240 |
Source: Public Records
Tax History
| Year | Tax Paid | Tax Assessment Tax Assessment Total Assessment is a certain percentage of the fair market value that is determined by local assessors to be the total taxable value of land and additions on the property. | Land | Improvement |
|---|---|---|---|---|
| 2025 | $3,238 | $490,000 | $0 | $0 |
| 2024 | $2,560 | $303,300 | $58,000 | $245,300 |
| 2023 | $2,543 | $303,300 | $58,000 | $245,300 |
| 2022 | $2,543 | $303,300 | $58,000 | $245,300 |
| 2021 | $2,541 | $303,300 | $58,000 | $245,300 |
| 2020 | $1,791 | $228,000 | $38,500 | $189,500 |
| 2019 | $2,256 | $228,000 | $38,500 | $189,500 |
| 2018 | $1,781 | $228,000 | $38,500 | $189,500 |
| 2017 | $2,370 | $228,000 | $38,500 | $189,500 |
| 2016 | $1,862 | $228,000 | $38,500 | $189,500 |
| 2015 | $1,886 | $228,000 | $38,500 | $189,500 |
| 2014 | $1,762 | $248,920 | $50,000 | $198,920 |
Source: Public Records
Map
Nearby Homes
- 2525 Whispering Way
- 217 Edenshire Ct
- 227 Edenshire Ct
- 333 Kennerly Dr
- 2012 Rosefield Ct
- 1081 Mapletree Ln
- 411 Carlisle Dr
- 236 Aylesbury Ln
- 300 Grover Moore Place
- 4208 Blanchard Cir
- 3007 Linstead Dr
- 4049 Fincher Rd Unit 3
- 217 Grover Moore Place
- 2000 Linstead Dr
- 4297 Canewood Ln
- 4324 Old Monroe Rd
- 205 Coventry Dr
- 5610 Golden Pond Dr
- 5535 Whispering Wind Ln
- 1002 Lavenham Place
- 2003 Sandbox Cir
- 1003 French Scout Ct
- 3001 Sandbox Cir
- 2001 Sandbox Cir
- 2008 Sandbox Cir
- 2006 Sandbox Cir
- 3003 Sandbox Cir
- 1002 French Scout Ct
- 3000 Sandbox Cir
- 2004 Sandbox Cir
- 1015 Sandbox Cir
- 1004 French Scout Ct
- 3002 Sandbox Cir
- 2002 Sandbox Cir
- 1006 French Scout Ct
- 1013 Sandbox Cir
- 1001 Talbot Ct
- 3004 Sandbox Cir
- 1011 Sandbox Cir
- 1009 Sandbox Cir
Your Personal Tour Guide
Ask me questions while you tour the home.