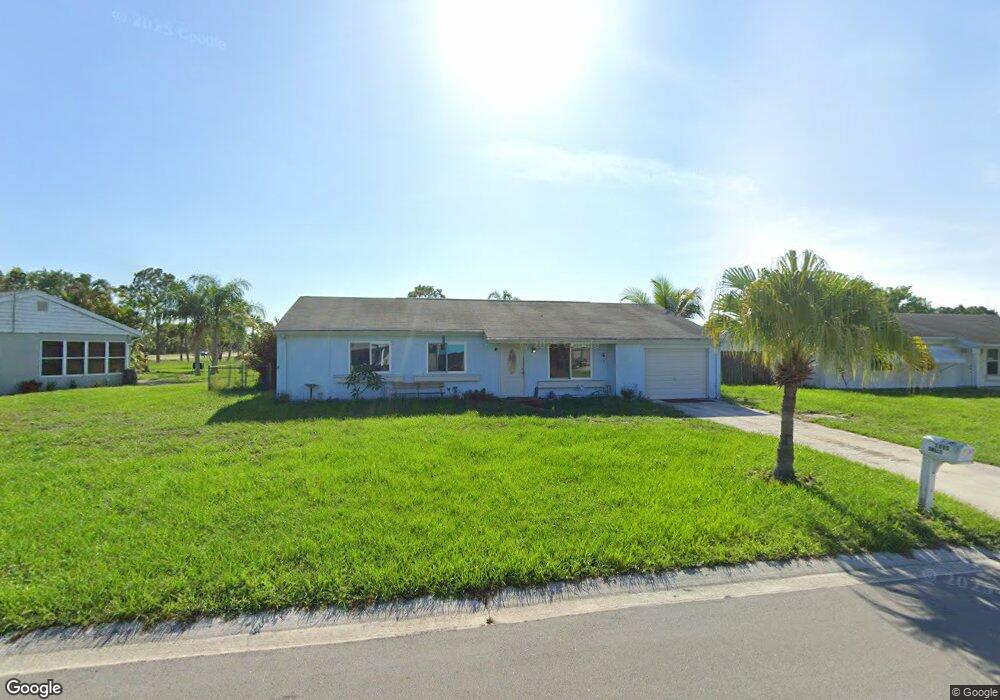
2005 SE Hideaway Cir Port Saint Lucie, FL 34952
Lyngate NeighborhoodEstimated Value: $287,304 - $311,000
2
Beds
2
Baths
1,176
Sq Ft
$250/Sq Ft
Est. Value
About This Home
This home is located at 2005 SE Hideaway Cir, Port Saint Lucie, FL 34952 and is currently estimated at $294,076, approximately $250 per square foot. 2005 SE Hideaway Cir is a home located in St. Lucie County with nearby schools including Morningside Elementary School, Floresta Elementary School, and Mariposa Elementary School.
Ownership History
Date
Name
Owned For
Owner Type
Purchase Details
Closed on
Apr 27, 2016
Sold by
Buice Brandy
Bought by
Smari Margaret A
Current Estimated Value
Purchase Details
Closed on
Aug 25, 2011
Sold by
Welf Leonardo
Bought by
Buice Brandi
Purchase Details
Closed on
Apr 14, 2011
Sold by
Welf Julie and Welf Julie L
Bought by
Welf Julie L
Purchase Details
Closed on
Dec 14, 2010
Sold by
The Secretary Of Veterans Affairs
Bought by
Welf Julie
Purchase Details
Closed on
Sep 30, 2010
Sold by
Morris Robert and Morris Natalie R
Bought by
Secretary Of Veterans Affairs
Purchase Details
Closed on
Apr 22, 2005
Sold by
Gryl Edward J
Bought by
Morris Robert and Morris Natalie R
Home Financials for this Owner
Home Financials are based on the most recent Mortgage that was taken out on this home.
Original Mortgage
$169,569
Interest Rate
5.88%
Mortgage Type
VA
Purchase Details
Closed on
Jul 13, 1998
Sold by
Gryl Edward J
Bought by
Gryl Edward J
Create a Home Valuation Report for This Property
The Home Valuation Report is an in-depth analysis detailing your home's value as well as a comparison with similar homes in the area
Home Values in the Area
Average Home Value in this Area
Purchase History
| Date | Buyer | Sale Price | Title Company |
|---|---|---|---|
| Smari Margaret A | $50,000 | None Available | |
| Buice Brandi | -- | Attorney | |
| Welf Julie L | -- | Attorney | |
| Welf Julie | $44,000 | Community Land Title Corp | |
| Secretary Of Veterans Affairs | -- | Attorney | |
| Morris Robert | $166,000 | Stewart Title Of Martin Coun | |
| Gryl Edward J | -- | -- |
Source: Public Records
Mortgage History
| Date | Status | Borrower | Loan Amount |
|---|---|---|---|
| Previous Owner | Morris Robert | $169,569 |
Source: Public Records
Tax History Compared to Growth
Tax History
| Year | Tax Paid | Tax Assessment Tax Assessment Total Assessment is a certain percentage of the fair market value that is determined by local assessors to be the total taxable value of land and additions on the property. | Land | Improvement |
|---|---|---|---|---|
| 2024 | $2,073 | $119,600 | -- | -- |
| 2023 | $2,073 | $116,117 | $0 | $0 |
| 2022 | $2,155 | $112,735 | $0 | $0 |
| 2021 | $2,053 | $109,452 | $0 | $0 |
| 2020 | $2,053 | $107,941 | $0 | $0 |
| 2019 | $2,023 | $105,515 | $0 | $0 |
| 2018 | $2,168 | $113,943 | $0 | $0 |
| 2017 | $2,138 | $111,000 | $28,000 | $83,000 |
| 2016 | $979 | $92,500 | $21,600 | $70,900 |
| 2015 | $977 | $68,100 | $13,600 | $54,500 |
| 2014 | $941 | $45,110 | $0 | $0 |
Source: Public Records
Map
Nearby Homes
- 2009 SE Hideaway Cir
- 2132 SE Shelter Dr
- 2102 SE Holland St
- 2126 SE Midtown Rd
- 1812 SE Hideaway Cir
- 2167 SE Sunflower St
- 2251 SE Holland St
- 2234 SE Shelter Dr
- 1914 SE Redwing Cir
- 1401 SE Portillo Rd
- 2150 SE Dolphin Rd
- 2080 SE Elmhurst Rd
- 1537 SE Blockton Ave
- 2241 SE Shipping Rd
- 1720 SE Linpark Ct
- Escambia Plan at Port St. Lucie
- Tula Plan at Port St. Lucie
- Jensen Plan at Port St. Lucie
- Coral Plan at Port St. Lucie
- Key West Plan at Port St. Lucie
- 2001 SE Hideaway Cir
- 2406 SE Hideaway Cir
- 2013 SE Hideaway Cir
- 2001 SE New York St
- 2006 SE Hideaway Cir
- 2017 SE Hideaway Cir
- 2010 SE Hideaway Cir
- 2014 SE Hideaway Cir
- 2021 SE Hideaway Cir
- 2062 SE Oxmoor Terrace
- 2013 SE New York St
- 2082 SE Oxmoor Terrace
- 2042 SE Oxmoor Terrace
- 2020 SE Hideaway Cir
- 2025 SE Hideaway Cir
- 2098 SE Oxmoor Terrace
- 2029 SE Hideaway Cir
- 2026 SE Hideaway Cir
- 2022 SE Oxmoor Terrace
- 2033 SE Hideaway Cir