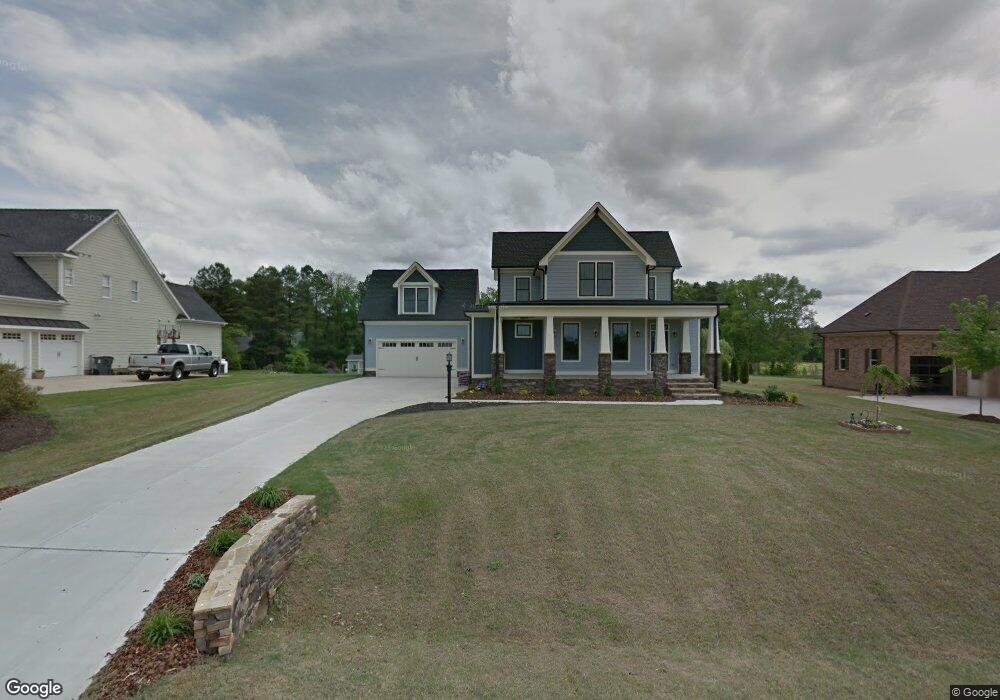
2005 Stonewall Farms Dr Unit 18 Fuquay Varina, NC 27526
Estimated Value: $705,237 - $772,000
--
Bed
1
Bath
2,578
Sq Ft
$284/Sq Ft
Est. Value
About This Home
This home is located at 2005 Stonewall Farms Dr Unit 18, Fuquay Varina, NC 27526 and is currently estimated at $732,809, approximately $284 per square foot. 2005 Stonewall Farms Dr Unit 18 is a home located in Wake County with nearby schools including Banks Road Elementary School and West Lake Middle.
Ownership History
Date
Name
Owned For
Owner Type
Purchase Details
Closed on
Feb 12, 2018
Sold by
Bronisz Thomas and Bronisz Hope
Bought by
Borrero Alexander and Borrero Dania
Current Estimated Value
Home Financials for this Owner
Home Financials are based on the most recent Mortgage that was taken out on this home.
Original Mortgage
$250,000
Outstanding Balance
$211,514
Interest Rate
3.95%
Mortgage Type
New Conventional
Estimated Equity
$521,295
Purchase Details
Closed on
Nov 22, 2011
Sold by
The Renovators Inc
Bought by
Bronisz Thomas and Bronisz Hope
Purchase Details
Closed on
Dec 20, 2006
Sold by
Perry Brothers Development Co Inc
Bought by
The Renovators Inc
Home Financials for this Owner
Home Financials are based on the most recent Mortgage that was taken out on this home.
Original Mortgage
$60,000
Interest Rate
6.31%
Mortgage Type
Purchase Money Mortgage
Create a Home Valuation Report for This Property
The Home Valuation Report is an in-depth analysis detailing your home's value as well as a comparison with similar homes in the area
Home Values in the Area
Average Home Value in this Area
Purchase History
| Date | Buyer | Sale Price | Title Company |
|---|---|---|---|
| Borrero Alexander | $366,000 | None Available | |
| Bronisz Thomas | $51,500 | Chicago Title Insurance Co | |
| The Renovators Inc | $60,000 | None Available |
Source: Public Records
Mortgage History
| Date | Status | Borrower | Loan Amount |
|---|---|---|---|
| Open | Borrero Alexander | $250,000 | |
| Previous Owner | The Renovators Inc | $60,000 |
Source: Public Records
Tax History Compared to Growth
Tax History
| Year | Tax Paid | Tax Assessment Tax Assessment Total Assessment is a certain percentage of the fair market value that is determined by local assessors to be the total taxable value of land and additions on the property. | Land | Improvement |
|---|---|---|---|---|
| 2025 | $4,798 | $747,079 | $150,000 | $597,079 |
| 2024 | $4,659 | $747,079 | $150,000 | $597,079 |
| 2023 | $3,311 | $422,021 | $65,000 | $357,021 |
| 2022 | $3,068 | $422,021 | $65,000 | $357,021 |
| 2021 | $2,986 | $422,021 | $65,000 | $357,021 |
| 2020 | $2,892 | $422,021 | $65,000 | $357,021 |
| 2019 | $2,941 | $357,651 | $60,000 | $297,651 |
| 2018 | $2,704 | $357,651 | $60,000 | $297,651 |
| 2017 | $2,563 | $357,651 | $60,000 | $297,651 |
| 2016 | $2,511 | $357,651 | $60,000 | $297,651 |
| 2015 | $2,745 | $392,385 | $62,000 | $330,385 |
| 2014 | $2,602 | $392,385 | $62,000 | $330,385 |
Source: Public Records
Map
Nearby Homes
- 3324 Air Park Rd
- 6208 Silver Spring Ct
- 1601 Malcus Ct Unit 65
- 1813 Middle Ridge Dr
- 6125 Willow Crest Ln
- 5817 Shedd Dr
- 1320 Taylor Farm Rd
- 4400 Emeline Way Unit 36
- 4301 Emeline Way Unit 15
- 4313 Darius Ln
- 1504 Malcus Ct Unit 52
- 4313 Darius Ln Unit 25
- 6112 Walnut Glen Dr
- 1401 Malcus Ct Unit 58
- Macon Plan at Rowland's Grant
- Knox Plan at Rowland's Grant
- Leland Plan at Rowland's Grant
- Jordan Plan at Rowland's Grant
- Camden Plan at Rowland's Grant
- Finley Plan at Rowland's Grant
- 2005 Stonewall Farms Dr
- 2009 Stonewall Farms Dr
- 1995 Stonewall Farms Dr
- 2013 Stonewall Farms Dr
- 1989 Stonewall Farms Dr
- 5632 Soft Wind Dr
- 2017 Stonewall Farms Dr
- 1990 Stonewall Farms Dr
- 2004 Stonewall Farms Dr
- 2004 Stonewall Farms Dr Unit 71
- 5628 Soft Wind Dr
- 2008 Stonewall Farms Dr
- 1994 Stonewall Farms Dr
- 1994 Stonewall Farms Dr Unit 72
- 1986 Stonewall Farms Dr
- 2021 Stonewall Farms Dr
- 2018 Stonewall Farms Dr
- 5624 Soft Wind Dr
- 5629 Soft Wind Dr
- 2025 Stonewall Farms Dr