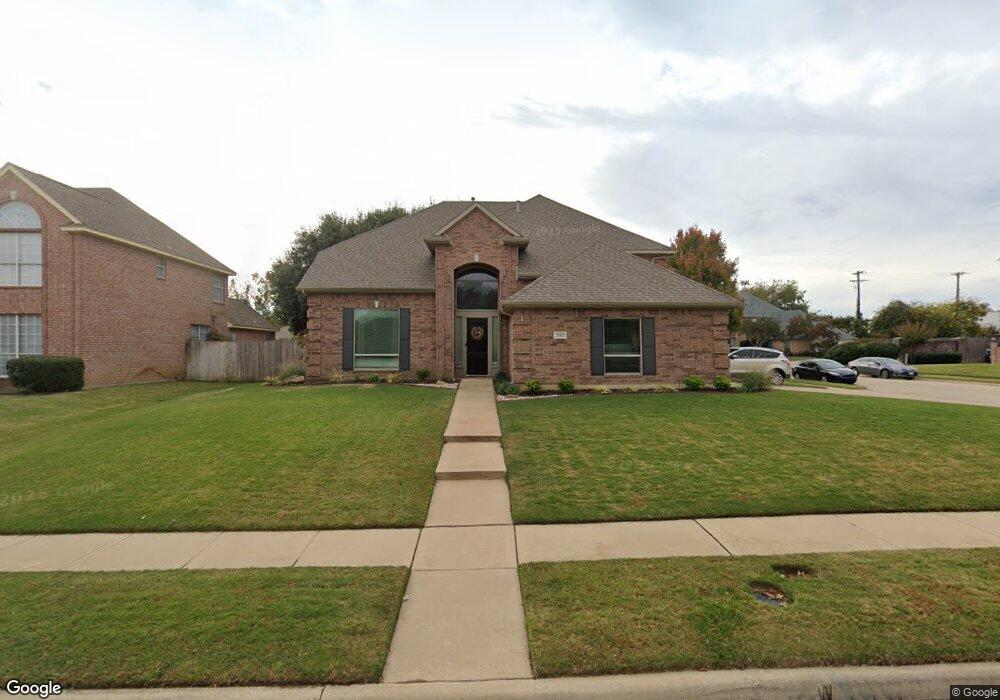
2005 Tarrant Ln Colleyville, TX 76034
Estimated Value: $719,825 - $834,000
4
Beds
2
Baths
2,818
Sq Ft
$270/Sq Ft
Est. Value
About This Home
This home is located at 2005 Tarrant Ln, Colleyville, TX 76034 and is currently estimated at $762,206, approximately $270 per square foot. 2005 Tarrant Ln is a home located in Tarrant County with nearby schools including Glenhope Elementary School, Cross Timbers Middle School, and Grapevine High School.
Ownership History
Date
Name
Owned For
Owner Type
Purchase Details
Closed on
Dec 13, 2000
Sold by
Swain Brent M and Swain Rebecca A
Bought by
Hagen William Russell and Hagen Jennifer Diane
Current Estimated Value
Home Financials for this Owner
Home Financials are based on the most recent Mortgage that was taken out on this home.
Original Mortgage
$190,400
Outstanding Balance
$70,265
Interest Rate
7.72%
Estimated Equity
$691,941
Purchase Details
Closed on
Sep 5, 1995
Sold by
Price Harold R and Price Harriet T
Bought by
Swain Brent M and Swain Rebecca A
Home Financials for this Owner
Home Financials are based on the most recent Mortgage that was taken out on this home.
Original Mortgage
$190,950
Interest Rate
7.58%
Purchase Details
Closed on
Aug 10, 1994
Sold by
Mike Sandlin Homes Inc
Bought by
Price Harold R and Price Harriet T
Home Financials for this Owner
Home Financials are based on the most recent Mortgage that was taken out on this home.
Original Mortgage
$167,400
Interest Rate
8.66%
Create a Home Valuation Report for This Property
The Home Valuation Report is an in-depth analysis detailing your home's value as well as a comparison with similar homes in the area
Home Values in the Area
Average Home Value in this Area
Purchase History
| Date | Buyer | Sale Price | Title Company |
|---|---|---|---|
| Hagen William Russell | -- | Alamo Title Company | |
| Swain Brent M | -- | American Title Co | |
| Price Harold R | -- | American Title Company |
Source: Public Records
Mortgage History
| Date | Status | Borrower | Loan Amount |
|---|---|---|---|
| Open | Hagen William Russell | $190,400 | |
| Previous Owner | Swain Brent M | $190,950 | |
| Previous Owner | Price Harold R | $167,400 |
Source: Public Records
Tax History Compared to Growth
Tax History
| Year | Tax Paid | Tax Assessment Tax Assessment Total Assessment is a certain percentage of the fair market value that is determined by local assessors to be the total taxable value of land and additions on the property. | Land | Improvement |
|---|---|---|---|---|
| 2025 | $2,283 | $489,100 | $128,450 | $360,650 |
| 2024 | $2,283 | $560,800 | $128,450 | $432,350 |
| 2023 | $7,925 | $624,300 | $128,450 | $495,850 |
| 2022 | $9,648 | $497,600 | $128,450 | $369,150 |
| 2021 | $9,753 | $444,099 | $110,001 | $334,098 |
| 2020 | $9,868 | $444,099 | $110,000 | $334,099 |
| 2019 | $10,268 | $444,100 | $110,000 | $334,100 |
| 2018 | $2,614 | $439,686 | $110,000 | $329,686 |
| 2017 | $9,443 | $399,714 | $95,000 | $304,714 |
| 2016 | $8,674 | $399,714 | $95,000 | $304,714 |
| 2015 | $7,537 | $333,800 | $40,000 | $293,800 |
| 2014 | $7,537 | $333,800 | $40,000 | $293,800 |
Source: Public Records
Map
Nearby Homes
- 2008 Kyle Ct
- 1509 Tinker Rd
- 7001 Colleyville Blvd
- 1813 Grosvenor Green
- 2406 Wilkes Dr
- 2602 Pointe Ct
- 2618 Pointe Ct
- 7208 Stilton Ct
- 1315 Hardage Ln
- 7106 Belle Meade Dr
- 3589 Boxwood Dr
- 7200 Belle Meade Dr
- 7322 Calloway Ct
- 7316 Calloway Ct
- 1417 Nottoway Ct
- 1418 Nottoway Ct
- 1406 Nottoway Ct
- 6805 Shalimar Ct
- 5613 Versailles Ct
- 6005 Valentino Ct
- 2007 Tarrant Ln
- 2008 Frances Dr
- 2001 Tarrant Ln
- 2009 Tarrant Ln
- 2004 Tarrant Ln
- 2003 Frances Dr
- 2002 Tarrant Ln
- 6601 Kennedy Dr
- 2011 Tarrant Ln
- 2000 Tarrant Ln
- 2012 Frances Dr
- 6603 Kennedy Dr
- 2013 Tarrant Ln
- 6602 Baker Ct
- 6600 Carriage Dr
- 2005 Frances Dr
- 6604 Baker Ct
- 2009 Frances Dr
- 2007 Frances Dr
- 6605 Kennedy Dr