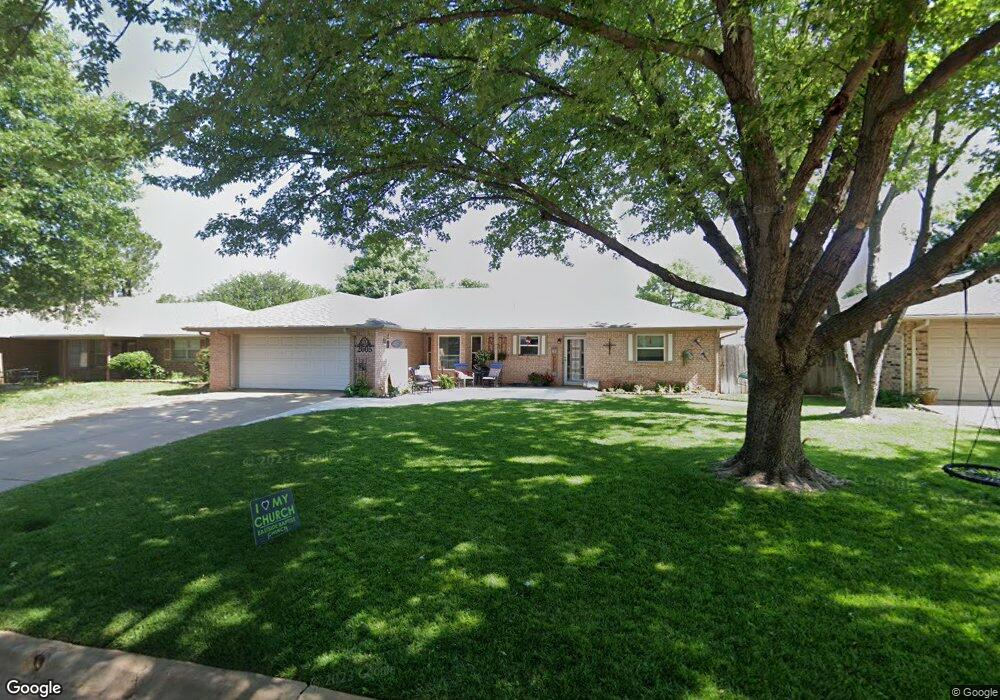
2005 Waverly Dr Duncan, OK 73533
Estimated Value: $190,000 - $231,000
3
Beds
2
Baths
2,038
Sq Ft
$101/Sq Ft
Est. Value
About This Home
This home is located at 2005 Waverly Dr, Duncan, OK 73533 and is currently estimated at $205,971, approximately $101 per square foot. 2005 Waverly Dr is a home located in Stephens County with nearby schools including Horace Mann Elementary School, Duncan Middle School, and Duncan High School.
Ownership History
Date
Name
Owned For
Owner Type
Purchase Details
Closed on
Jun 30, 2010
Sold by
Reynolds Teddy C and Reynolds Lucinda
Bought by
Dutton Vernon P and Dutton Kathy L
Current Estimated Value
Home Financials for this Owner
Home Financials are based on the most recent Mortgage that was taken out on this home.
Original Mortgage
$121,677
Outstanding Balance
$82,660
Interest Rate
5.25%
Mortgage Type
FHA
Estimated Equity
$123,311
Purchase Details
Closed on
Mar 14, 2007
Sold by
Lowery Roger Alan and Lowery Nora Elaine
Bought by
Reynolds Teddy C and Reynolds Lucinda
Home Financials for this Owner
Home Financials are based on the most recent Mortgage that was taken out on this home.
Original Mortgage
$77,680
Interest Rate
6.3%
Mortgage Type
New Conventional
Purchase Details
Closed on
Oct 5, 2004
Sold by
Lowery Rosemary
Purchase Details
Closed on
Oct 1, 2002
Sold by
Hobbs Nathan and Hobbs Doris
Purchase Details
Closed on
Apr 30, 2002
Sold by
Hobbs Nathan and Hobbs Doris
Create a Home Valuation Report for This Property
The Home Valuation Report is an in-depth analysis detailing your home's value as well as a comparison with similar homes in the area
Purchase History
| Date | Buyer | Sale Price | Title Company |
|---|---|---|---|
| Dutton Vernon P | $125,000 | Stewart Abstract & Title Of | |
| Reynolds Teddy C | $97,100 | None Available | |
| -- | -- | -- | |
| -- | $109,500 | -- | |
| -- | -- | -- |
Source: Public Records
Mortgage History
| Date | Status | Borrower | Loan Amount |
|---|---|---|---|
| Open | Dutton Vernon P | $121,677 | |
| Previous Owner | Reynolds Teddy C | $77,680 |
Source: Public Records
Tax History
| Year | Tax Paid | Tax Assessment Tax Assessment Total Assessment is a certain percentage of the fair market value that is determined by local assessors to be the total taxable value of land and additions on the property. | Land | Improvement |
|---|---|---|---|---|
| 2025 | $1,352 | $17,034 | $818 | $16,216 |
| 2024 | $1,282 | $16,056 | $818 | $15,238 |
| 2023 | $1,282 | $16,056 | $818 | $15,238 |
| 2022 | $1,202 | $15,588 | $818 | $14,770 |
| 2021 | $1,166 | $14,694 | $818 | $13,876 |
| 2020 | $1,149 | $14,303 | $818 | $13,485 |
| 2019 | $1,115 | $13,886 | $818 | $13,068 |
| 2018 | $1,112 | $13,482 | $818 | $12,664 |
| 2017 | $1,058 | $13,316 | $818 | $12,498 |
| 2016 | $1,095 | $13,888 | $818 | $13,070 |
| 2015 | $1,090 | $13,888 | $818 | $13,070 |
| 2014 | $1,090 | $13,497 | $818 | $12,679 |
Source: Public Records
Map
Nearby Homes
- 1829 Terrace Dr
- 1923 Windsor Dr
- 2021 Overland Dr
- 2363 Rockwell Dr
- 2318 Rockwell Dr
- 2345 Rockwell Dr
- 2375 Rockwell Dr
- 2330 Rockwell Dr
- 2346 Rockwell Dr
- Monroe Plan at Wilkinson
- Jefferson Plan at Wilkinson
- Roosevelt Plan at Wilkinson
- 2387 Rockwell Dr
- 2403 Meadow View Dr
- 2024 N Woodrock Dr
- 2360 Rockwell Dr
- 2333 Rockwell Dr
- 2321 Rockwell Dr
- 2129 W Mallard Dr
- 1927 High Meadow Dr
- 2009 Waverly Dr
- 2001 Waverly Dr
- 2006 Windsor Dr
- 2013 Waverly Dr
- 2002 Windsor Dr
- 2010 Windsor Dr
- 2006 Waverly Dr
- 2010 Waverly Dr
- 2002 2002 Waverly
- 2002 Waverly Dr
- 2017 Waverly Dr
- 1917 Waverly Dr
- 2014 Windsor Dr
- 1934 Windsor Dr
- 1916 Waverly Dr
- 2021 Waverly Dr
- 1817 Overland Dr
- 2021 2021 Waverly Dr
- 1826 Terrace Dr
- 1913 Waverly Dr
Your Personal Tour Guide
Ask me questions while you tour the home.