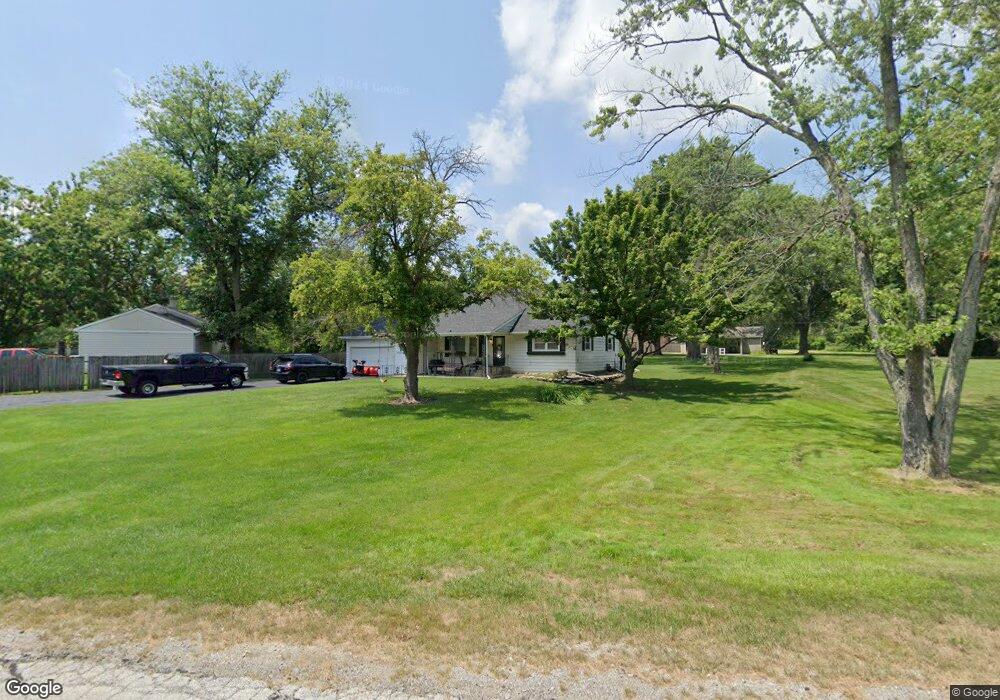
20050 Keystone Ave Matteson, IL 60443
Old Matteson NeighborhoodEstimated Value: $264,000 - $306,779
3
Beds
3
Baths
2,340
Sq Ft
$125/Sq Ft
Est. Value
About This Home
This home is located at 20050 Keystone Ave, Matteson, IL 60443 and is currently estimated at $292,195, approximately $124 per square foot. 20050 Keystone Ave is a home located in Cook County with nearby schools including Illinois School, Arcadia Elementary School, and Indiana Elementary School.
Ownership History
Date
Name
Owned For
Owner Type
Purchase Details
Closed on
Dec 14, 2005
Sold by
Thompson Jake
Bought by
Yule Valerie
Current Estimated Value
Home Financials for this Owner
Home Financials are based on the most recent Mortgage that was taken out on this home.
Original Mortgage
$109,000
Outstanding Balance
$60,315
Interest Rate
6.4%
Mortgage Type
Fannie Mae Freddie Mac
Estimated Equity
$231,880
Purchase Details
Closed on
Feb 28, 2005
Sold by
Dabner Thompson Lelah and Thompson Jake
Bought by
Thompson Jake
Home Financials for this Owner
Home Financials are based on the most recent Mortgage that was taken out on this home.
Original Mortgage
$146,600
Interest Rate
5.64%
Mortgage Type
New Conventional
Purchase Details
Closed on
Jun 25, 1997
Sold by
Beverly Trust Company
Bought by
Thompson Jake and Thompson Lelah Dabner
Home Financials for this Owner
Home Financials are based on the most recent Mortgage that was taken out on this home.
Original Mortgage
$151,943
Interest Rate
8.01%
Mortgage Type
FHA
Create a Home Valuation Report for This Property
The Home Valuation Report is an in-depth analysis detailing your home's value as well as a comparison with similar homes in the area
Home Values in the Area
Average Home Value in this Area
Purchase History
| Date | Buyer | Sale Price | Title Company |
|---|---|---|---|
| Yule Valerie | $210,000 | Cti | |
| Thompson Jake | -- | Cti | |
| Thompson Jake | $156,000 | Ticor Title |
Source: Public Records
Mortgage History
| Date | Status | Borrower | Loan Amount |
|---|---|---|---|
| Open | Yule Valerie | $109,000 | |
| Previous Owner | Thompson Jake | $146,600 | |
| Previous Owner | Thompson Jake | $151,943 |
Source: Public Records
Tax History
| Year | Tax Paid | Tax Assessment Tax Assessment Total Assessment is a certain percentage of the fair market value that is determined by local assessors to be the total taxable value of land and additions on the property. | Land | Improvement |
|---|---|---|---|---|
| 2025 | $6,392 | $20,080 | $2,600 | $17,480 |
| 2024 | $6,392 | $20,080 | $2,600 | $17,480 |
| 2023 | $5,651 | $20,080 | $2,600 | $17,480 |
| 2022 | $5,651 | $14,721 | $4,680 | $10,041 |
| 2021 | $5,717 | $14,721 | $4,680 | $10,041 |
| 2020 | $5,387 | $14,721 | $4,680 | $10,041 |
| 2019 | $6,280 | $16,889 | $4,160 | $12,729 |
| 2018 | $6,018 | $16,889 | $4,160 | $12,729 |
| 2017 | $5,845 | $16,889 | $4,160 | $12,729 |
| 2016 | $5,520 | $15,106 | $3,640 | $11,466 |
| 2015 | $5,419 | $15,106 | $3,640 | $11,466 |
| 2014 | $6,042 | $16,760 | $3,640 | $13,120 |
| 2013 | $4,476 | $13,948 | $3,640 | $10,308 |
Source: Public Records
Map
Nearby Homes
- 20120 Keystone Ave
- 154 Sundance Rd
- 136 Moonlight Rd
- 153 Treehouse Rd
- 20001 Arquilla Cir
- 4012 204th St
- 19611 Crawford Ave
- 4500 203rd St
- 1442 Kinross St
- 19435 Hickory Place Unit 29A
- 20415 Doria Ln
- 3451 Ithaca Rd
- 20920 Governors Hwy
- 4242 Pinewood Ln
- 20436 Arcadian Dr
- 3427 Vollmer Rd Unit 202
- 3415 Vollmer Rd Unit 308
- 20535 Marathon Ct
- 722 Kostner Ave
- 4169 193rd Ct Unit 11A
- 20056 Keystone Ave
- 20030 Keystone Ave
- 4102 Orchard Ln
- 20031 Keystone Ave
- 4108 Orchard Ln
- 20021 Keystone Ave
- 4107 Orchard Ln
- 20020 Keystone Ave Unit 1
- 20047 Keystone Ave
- 4110 Orchard Ln
- 4110 Orchard Ln
- 20001 Keystone Ave
- 20001 Keystone Ave
- 4105 Sunset Rd
- 20000 Keystone Ave
- 20000 Keystone Ave
- 4111 Orchard Ln
- 4113 Sunset Rd
- 20121 Keystone Ave
- 4026 Thornwood Ave
Your Personal Tour Guide
Ask me questions while you tour the home.