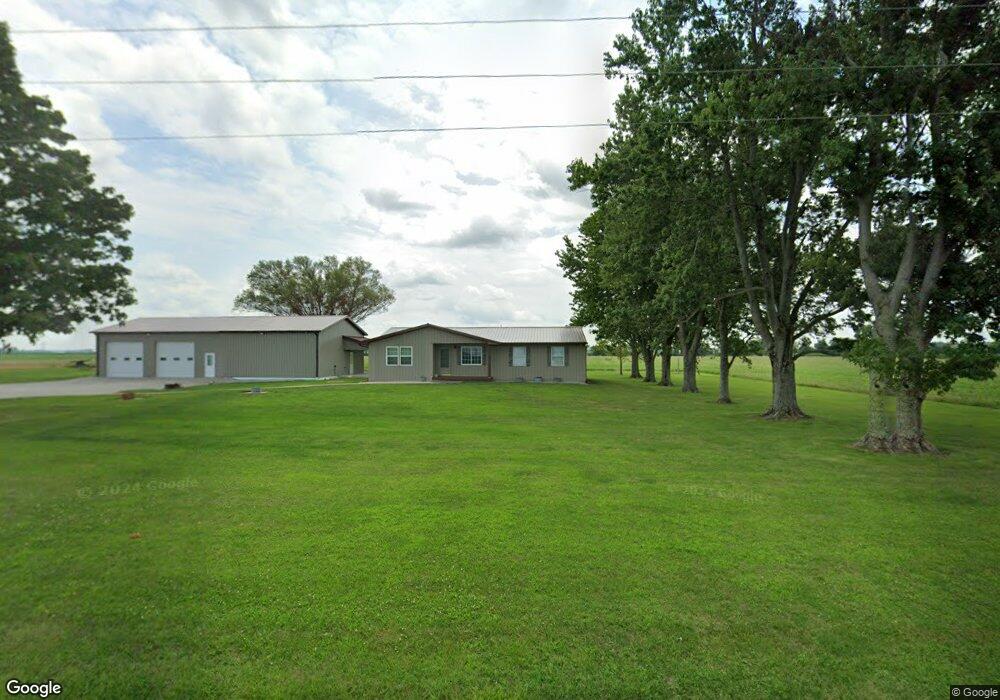
20052 Chapman T Trail Fillmore, IL 62032
Estimated Value: $111,208 - $190,000
3
Beds
1
Bath
1,120
Sq Ft
$146/Sq Ft
Est. Value
About This Home
This home is located at 20052 Chapman T Trail, Fillmore, IL 62032 and is currently estimated at $163,403, approximately $145 per square foot. 20052 Chapman T Trail is a home located in Montgomery County with nearby schools including Hillsboro High School.
Ownership History
Date
Name
Owned For
Owner Type
Purchase Details
Closed on
Jan 25, 2006
Sold by
Hartman Gina
Bought by
Moore Aaron P
Current Estimated Value
Home Financials for this Owner
Home Financials are based on the most recent Mortgage that was taken out on this home.
Original Mortgage
$56,000
Outstanding Balance
$32,009
Interest Rate
6.46%
Mortgage Type
New Conventional
Estimated Equity
$131,394
Purchase Details
Closed on
Nov 1, 2003
Bought by
Moore Aaron
Create a Home Valuation Report for This Property
The Home Valuation Report is an in-depth analysis detailing your home's value as well as a comparison with similar homes in the area
Home Values in the Area
Average Home Value in this Area
Purchase History
| Date | Buyer | Sale Price | Title Company |
|---|---|---|---|
| Moore Aaron P | -- | None Available | |
| Moore Aaron | $41,200 | -- |
Source: Public Records
Mortgage History
| Date | Status | Borrower | Loan Amount |
|---|---|---|---|
| Open | Moore Aaron P | $56,000 |
Source: Public Records
Tax History Compared to Growth
Tax History
| Year | Tax Paid | Tax Assessment Tax Assessment Total Assessment is a certain percentage of the fair market value that is determined by local assessors to be the total taxable value of land and additions on the property. | Land | Improvement |
|---|---|---|---|---|
| 2024 | $864 | $17,733 | $3,730 | $14,003 |
| 2023 | $830 | $16,663 | $3,430 | $13,233 |
| 2022 | $803 | $16,093 | $3,230 | $12,863 |
| 2021 | $761 | $15,193 | $2,990 | $12,203 |
| 2020 | $696 | $14,243 | $2,740 | $11,503 |
| 2019 | $642 | $13,673 | $2,560 | $11,113 |
| 2018 | $592 | $13,043 | $2,380 | $10,663 |
| 2017 | $575 | $12,623 | $2,240 | $10,383 |
| 2016 | $559 | $12,363 | $2,140 | $10,223 |
| 2015 | $583 | $12,463 | $2,100 | $10,363 |
| 2013 | $562 | $12,293 | $2,020 | $10,273 |
Source: Public Records
Map
Nearby Homes
- 106 Locust St
- TBD Red Ball Trail
- 102 3rd St
- 000 E 24th Rd
- 171 Red Ball Trail
- 0 Sec 29-7-1w Unit MIS25047631
- 1847 Jaketown Rd
- 215 S Pine St
- 456 E 2595 Ave
- 425 N Pine St
- 299 E 3050 Ave
- 141 Lakecrest Ln
- 316 Mill Ln
- 1910 Washington St
- 523 E Tremont St
- 631 Chase St
- 220 N Grant St
- 1311 Center St
- 123 N East St
- 1495 Woburn Ave