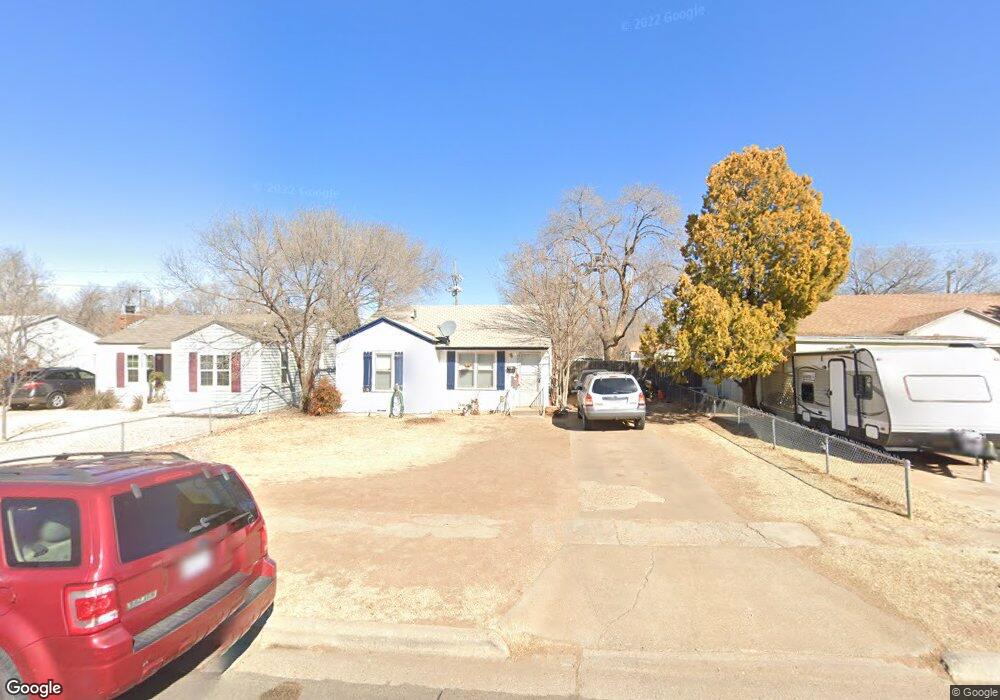
2006 41st St Lubbock, TX 79412
Clapp Park NeighborhoodEstimated Value: $63,599 - $109,000
2
Beds
1
Bath
754
Sq Ft
$105/Sq Ft
Est. Value
About This Home
This home is located at 2006 41st St, Lubbock, TX 79412 and is currently estimated at $79,150, approximately $104 per square foot. 2006 41st St is a home located in Lubbock County with nearby schools including Brown Elementary School, Slaton Middle School, and Monterey High School.
Ownership History
Date
Name
Owned For
Owner Type
Purchase Details
Closed on
Aug 29, 2024
Sold by
Marsh Matthew and Nisim Hen
Bought by
Milk And Honey Group Llc
Current Estimated Value
Purchase Details
Closed on
Jul 11, 2016
Sold by
Clark Glenda and Clark Donald
Bought by
Marsh Matthew and Nisim Hen
Purchase Details
Closed on
Aug 4, 1993
Sold by
Remodeled Properties Inc
Bought by
Marsh Matthew and Nisim Hen
Purchase Details
Closed on
Jul 2, 1992
Bought by
Marsh Matthew and Nisim Hen
Create a Home Valuation Report for This Property
The Home Valuation Report is an in-depth analysis detailing your home's value as well as a comparison with similar homes in the area
Home Values in the Area
Average Home Value in this Area
Purchase History
| Date | Buyer | Sale Price | Title Company |
|---|---|---|---|
| Milk And Honey Group Llc | -- | None Listed On Document | |
| Marsh Matthew | -- | None Available | |
| Marsh Matthew | -- | -- | |
| Marsh Matthew | -- | -- |
Source: Public Records
Tax History Compared to Growth
Tax History
| Year | Tax Paid | Tax Assessment Tax Assessment Total Assessment is a certain percentage of the fair market value that is determined by local assessors to be the total taxable value of land and additions on the property. | Land | Improvement |
|---|---|---|---|---|
| 2025 | $965 | $53,151 | $2,750 | $50,401 |
| 2024 | $965 | $53,151 | $2,750 | $50,401 |
| 2023 | $988 | $53,151 | $2,750 | $50,401 |
| 2022 | $952 | $47,037 | $2,750 | $44,287 |
| 2021 | $800 | $37,370 | $2,750 | $34,620 |
| 2020 | $757 | $34,805 | $2,750 | $32,055 |
| 2019 | $758 | $33,779 | $2,750 | $31,029 |
| 2018 | $759 | $33,779 | $2,750 | $31,029 |
| 2017 | $697 | $30,958 | $2,750 | $28,208 |
| 2015 | $646 | $27,622 | $2,750 | $24,872 |
| 2014 | $646 | $29,038 | $2,750 | $26,288 |
Source: Public Records
Map
Nearby Homes