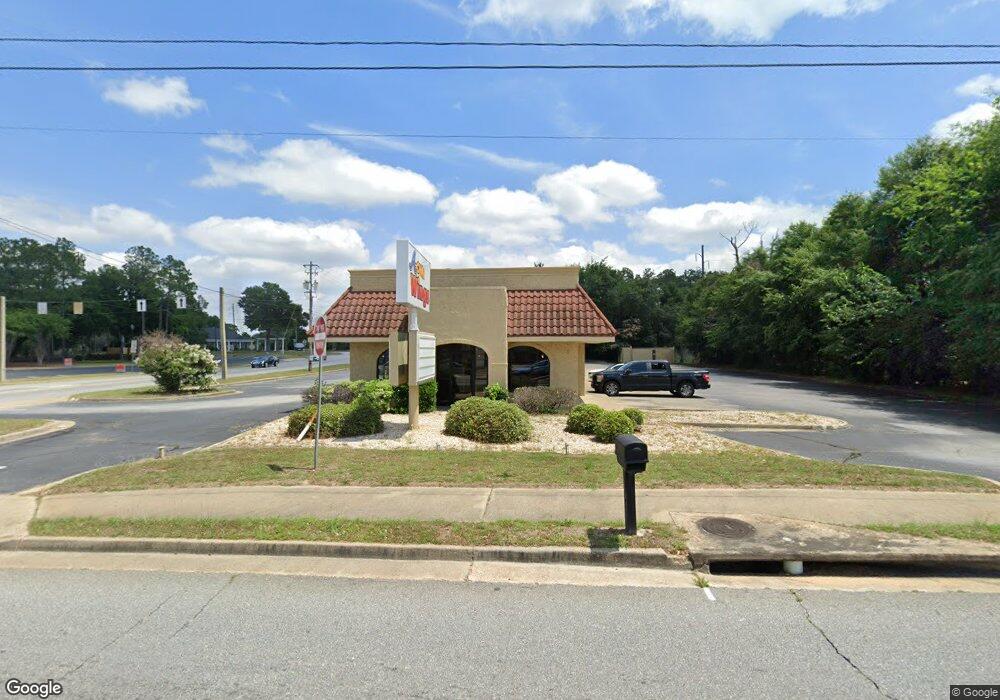
2006 E Oglethorpe Blvd Albany, GA 31705
Estimated Value: $813,900
Studio
--
Bath
2,699
Sq Ft
$302/Sq Ft
Est. Value
About This Home
This home is located at 2006 E Oglethorpe Blvd, Albany, GA 31705 and is currently estimated at $813,900, approximately $301 per square foot. 2006 E Oglethorpe Blvd is a home located in Dougherty County with nearby schools including Turner Elementary School, Albany Middle School, and Dougherty Comprehensive High School.
Ownership History
Date
Name
Owned For
Owner Type
Purchase Details
Closed on
Mar 15, 2022
Sold by
Albbtj Llc
Bought by
Gainest Inc
Current Estimated Value
Purchase Details
Closed on
Sep 17, 2020
Sold by
Luckana Llc
Bought by
Albbtj Llc
Purchase Details
Closed on
Jul 12, 2013
Sold by
Weng & Liang Llc
Bought by
Luckana Llc
Purchase Details
Closed on
Apr 19, 2006
Sold by
Ldvf1f Taco Llc
Bought by
Weng & Liang Llc
Purchase Details
Closed on
Aug 16, 2005
Sold by
Tacala Llc
Bought by
Ldvf1f Taco Llc
Purchase Details
Closed on
Jun 8, 1995
Sold by
Taco Del Sur Inc
Bought by
Border Properties Ltd
Purchase Details
Closed on
Jan 28, 1995
Sold by
Faulk Glenda Sue M Heard C M and Faulk Klein J
Bought by
Taco Del Dur Inc
Purchase Details
Closed on
Jan 27, 1995
Sold by
Faulk Glenda Sue M Heard C M and Faulk Klein J
Bought by
Taco Del Sur Inc
Purchase Details
Closed on
Jul 21, 1993
Sold by
Miles Clinton
Bought by
Faulk Glenda Sue and Cynthia Heard
Purchase Details
Closed on
Nov 16, 1981
Sold by
Pecan Haven
Bought by
Miles Clinton
Create a Home Valuation Report for This Property
The Home Valuation Report is an in-depth analysis detailing your home's value as well as a comparison with similar homes in the area
Purchase History
| Date | Buyer | Sale Price | Title Company |
|---|---|---|---|
| Gainest Inc | $680,000 | -- | |
| Albbtj Llc | $450,000 | -- | |
| Luckana Llc | $1,180,000 | -- | |
| Weng & Liang Llc | $1,025,000 | -- | |
| Ldvf1f Taco Llc | $858,824 | -- | |
| Border Properties Ltd | $340,600 | -- | |
| Taco Del Dur Inc | -- | -- | |
| Taco Del Sur Inc | $325,000 | -- | |
| Faulk Glenda Sue | $230,000 | -- | |
| Miles Clinton | $130,000 | -- |
Source: Public Records
Map
Nearby Homes
- 213 Monarch Dr
- 215 Franklin Dr
- 147 Old Johnson Rd
- 133 Thornton Dr
- 306 Elsom St
- 1606 Kieve Ave
- 2539 Crescent Dr
- 2529 Cherokee Dr
- 410 Johnson Rd
- 2531 Cherokee Dr
- 3625 Sylvester Rd
- 511 Johnson Rd
- 1521 E Broad Ave
- 608 Cason St
- 811 S Maple St
- 1411 E Gordon Ave
- 1403 E Waddell Ave
- 1401 E Waddell Ave
- 1400 E Lincoln Ave
- 210 S Carroll St
- 2004 E Oglethorpe Blvd
- 216 Monarch Dr
- 2111 E Oglethorpe Blvd
- 212 Monarch Dr
- 210 Monarch Dr
- 217 Monarch Dr
- 206 Monarch Dr
- 215 Monarch Dr
- 207 Loftus Dr
- 204 Monarch Dr
- 1905 Fulton Ave
- 211 Monarch Dr
- 2200 E Oglethorpe Blvd
- 209 Monarch Dr
- 1903 Fulton Ave
- 212 Wright Dr
- 2002 Keystone Ave
- 216 Franklin Dr
- 207 Monarch Dr
- 214 Wright Dr
Your Personal Tour Guide
Ask me questions while you tour the home.