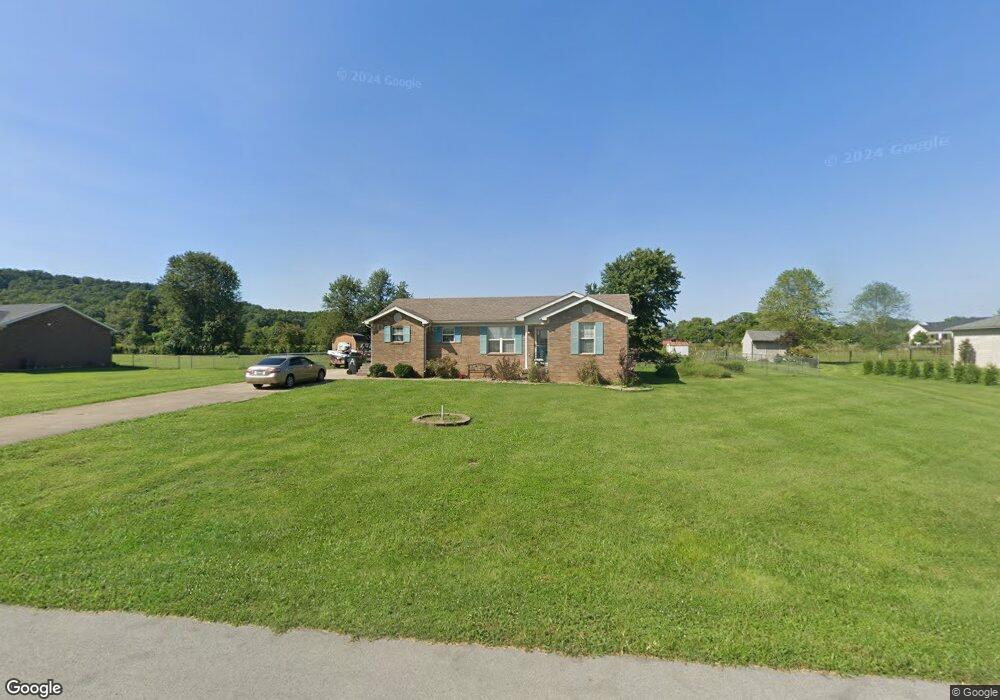
2006 E Sandstone Ct Bardstown, KY 40004
3
Beds
2
Baths
1,350
Sq Ft
30,928
Sq Ft Lot
About This Home
This home is located at 2006 E Sandstone Ct, Bardstown, KY 40004. 2006 E Sandstone Ct is a home located in Nelson County with nearby schools including Nelson County High School and Nelson County Baptist School.
Ownership History
Date
Name
Owned For
Owner Type
Purchase Details
Closed on
Mar 24, 2017
Sold by
Nalley David Michael and Nalley Brenda G
Bought by
Nalley David Michael and Nalley Brenda G
Home Financials for this Owner
Home Financials are based on the most recent Mortgage that was taken out on this home.
Original Mortgage
$95,500
Outstanding Balance
$78,384
Interest Rate
4.15%
Mortgage Type
New Conventional
Purchase Details
Closed on
Mar 18, 2016
Sold by
The Secretary Of Housing & Urban Develop
Bought by
Nalley David Michael
Home Financials for this Owner
Home Financials are based on the most recent Mortgage that was taken out on this home.
Original Mortgage
$91,364
Interest Rate
3.65%
Mortgage Type
Construction
Purchase Details
Closed on
Dec 21, 2015
Sold by
Citimortgage Inc
Bought by
The Secretary Of Housing & Urban Develop
Purchase Details
Closed on
Jun 16, 2015
Sold by
Nichols John and Nichols Elizabeth
Bought by
Citimortgage Inc
Create a Home Valuation Report for This Property
The Home Valuation Report is an in-depth analysis detailing your home's value as well as a comparison with similar homes in the area
Purchase History
| Date | Buyer | Sale Price | Title Company |
|---|---|---|---|
| Nalley David Michael | -- | Attorney | |
| Nalley David Michael | $90,000 | Attorney | |
| The Secretary Of Housing & Urban Develop | -- | Servicelink | |
| Citimortgage Inc | $80,000 | Attorney |
Source: Public Records
Mortgage History
| Date | Status | Borrower | Loan Amount |
|---|---|---|---|
| Open | Nalley David Michael | $95,500 | |
| Closed | Nalley David Michael | $91,364 |
Source: Public Records
Tax History
| Year | Tax Paid | Tax Assessment Tax Assessment Total Assessment is a certain percentage of the fair market value that is determined by local assessors to be the total taxable value of land and additions on the property. | Land | Improvement |
|---|---|---|---|---|
| 2025 | $1,635 | $159,790 | $0 | $0 |
| 2024 | $1,635 | $148,800 | $0 | $0 |
| 2023 | $1,635 | $148,800 | $0 | $0 |
| 2022 | $1,668 | $148,800 | $0 | $148,800 |
| 2021 | $1,688 | $148,800 | $0 | $148,800 |
| 2020 | $1,652 | $148,800 | $0 | $148,800 |
| 2019 | $1,731 | $148,800 | $0 | $148,800 |
| 2018 | $1,327 | $110,000 | $0 | $110,000 |
| 2017 | $1,236 | $90,000 | $0 | $90,000 |
| 2016 | $1,236 | $110,000 | $110,000 | $0 |
| 2015 | $1,236 | $110,000 | $110,000 | $0 |
| 2014 | $1,146 | $110,000 | $110,000 | $0 |
| 2012 | $1,146 | $110,000 | $110,000 | $0 |
Source: Public Records
Map
Nearby Homes
- 870 Lutheran Church Rd
- 950 Lutheran Church Rd
- 117 Lorenza Cir
- 103 Ruth Ln
- 215 Ruth Ln
- 134 Lorenza Cir
- 1595 Lutheran Church Rd
- 1526 Lutheran Church Rd
- 3625 New Shepherdsville Rd
- 460 Stonehouse Rd
- 3734 New Shepherdsville Rd
- 2997 Old Nazareth Rd
- 5506 New Shepherdsville Rd
- 104 Locust Grove Ct
- 107 Creel Ln
- 0 Kentucky 245
- 1 New Shepherdsville Rd
- 6269 New Shepherdsville Rd
- 112 Venetian Way
- 112 Jellico Dr
- 2006 Sandstone Ct
- 2004 Sandstone Ct
- 2008 Sandstone Ct
- 2007 W Sandstone Ct
- 2005 W Sandstone Ct
- 2007 Sandstone Ct
- 2005 E Sandstone Ct
- 2005 Sandstone Ct
- 2009 Sandstone Ct
- 2002 Sandstone Ct
- 2002 Sandstone Ct
- 2010 Sandstone Ct
- 2011 W Sandstone Ct
- 2003 Sandstone Ct
- 2003 Sandstone Ct
- 2011 Sandstone Ct
- 2011 Sandstone Ct
- 2013 W Sandstone Ct
- 2012 Sandstone Ct Unit 1
- 2012 Sandstone Ct
Your Personal Tour Guide
Ask me questions while you tour the home.