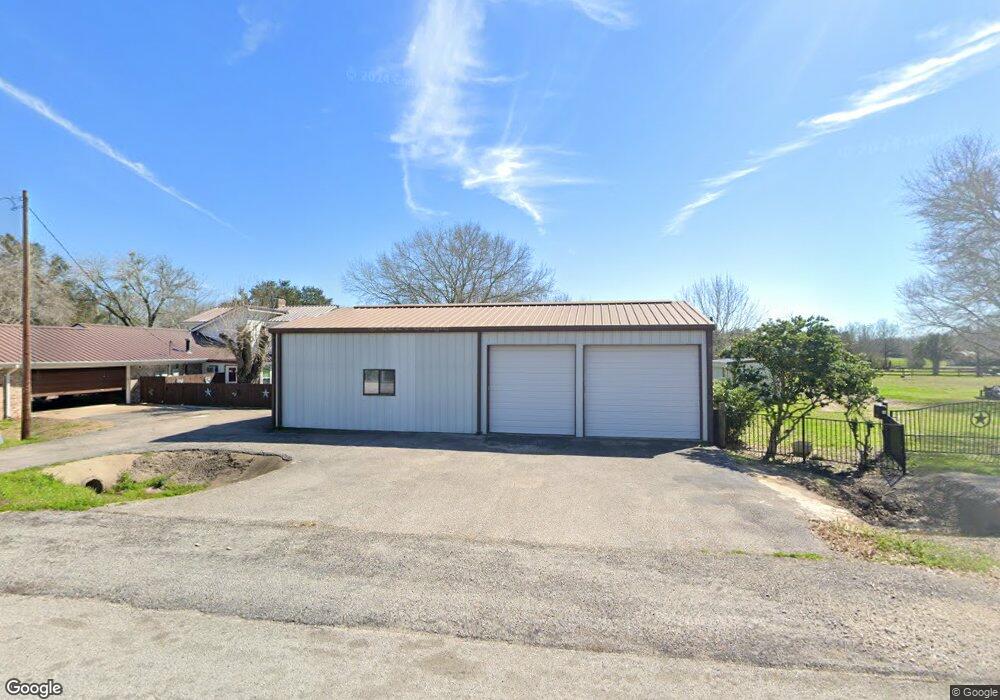
2006 Finney Vallet Rd Rosenberg, TX 77471
Estimated Value: $592,169 - $676,000
3
Beds
3
Baths
3,252
Sq Ft
$196/Sq Ft
Est. Value
About This Home
This home is located at 2006 Finney Vallet Rd, Rosenberg, TX 77471 and is currently estimated at $636,292, approximately $195 per square foot. 2006 Finney Vallet Rd is a home located in Fort Bend County with nearby schools including Beasley Elementary School, George Junior High School, and B.F. Terry High School.
Ownership History
Date
Name
Owned For
Owner Type
Purchase Details
Closed on
Feb 10, 2005
Sold by
Allison Charles and Allison Patricia
Bought by
Mulkey William T and Mulkey Barbara J
Current Estimated Value
Home Financials for this Owner
Home Financials are based on the most recent Mortgage that was taken out on this home.
Original Mortgage
$152,000
Interest Rate
5.77%
Mortgage Type
Fannie Mae Freddie Mac
Purchase Details
Closed on
Jun 30, 1998
Sold by
Hood Robert E and Hood Gail
Bought by
Mulkey William T and Mulkey Barbara J
Home Financials for this Owner
Home Financials are based on the most recent Mortgage that was taken out on this home.
Original Mortgage
$70,000
Interest Rate
7.05%
Purchase Details
Closed on
Jun 29, 1998
Sold by
Hood Robert E and Hood Gail
Bought by
Allison Charles and Allison Patricia
Home Financials for this Owner
Home Financials are based on the most recent Mortgage that was taken out on this home.
Original Mortgage
$70,000
Interest Rate
7.05%
Purchase Details
Closed on
Jun 16, 1994
Sold by
Williams Lewis T
Bought by
Mulkey William T and Mulkey Barbara J
Create a Home Valuation Report for This Property
The Home Valuation Report is an in-depth analysis detailing your home's value as well as a comparison with similar homes in the area
Home Values in the Area
Average Home Value in this Area
Purchase History
| Date | Buyer | Sale Price | Title Company |
|---|---|---|---|
| Mulkey William T | -- | American Title Co | |
| Mulkey William T | -- | -- | |
| Allison Charles | -- | Texas American Title Co | |
| Mulkey William T | -- | -- |
Source: Public Records
Mortgage History
| Date | Status | Borrower | Loan Amount |
|---|---|---|---|
| Closed | Mulkey William T | $152,000 | |
| Previous Owner | Allison Charles | $70,000 |
Source: Public Records
Tax History
| Year | Tax Paid | Tax Assessment Tax Assessment Total Assessment is a certain percentage of the fair market value that is determined by local assessors to be the total taxable value of land and additions on the property. | Land | Improvement |
|---|---|---|---|---|
| 2025 | $1,929 | $487,559 | $226,965 | $460,548 |
| 2024 | $1,929 | $443,235 | -- | $502,872 |
| 2023 | $1,797 | $402,941 | $0 | $511,637 |
| 2022 | $3,661 | $366,310 | $0 | $390,510 |
| 2021 | $5,977 | $333,010 | $39,440 | $293,570 |
| 2020 | $6,268 | $343,950 | $39,440 | $304,510 |
| 2019 | $6,150 | $314,750 | $22,220 | $292,530 |
| 2018 | $5,606 | $286,140 | $22,220 | $263,920 |
| 2017 | $4,849 | $260,130 | $22,220 | $237,910 |
| 2016 | $4,439 | $238,130 | $22,220 | $215,910 |
| 2015 | $2,909 | $247,280 | $22,220 | $225,060 |
| 2014 | $3,039 | $242,800 | $22,220 | $220,580 |
Source: Public Records
Map
Nearby Homes
- 2606 Finney Vallet Rd
- 2607 Finney Vallet Rd
- 4440 Sims Rd
- 0 Kunz Rd
- 00 Kunz Rd
- 1626 Hartledge Rd
- 00 Hartledge Rd
- 1414 Hartledge Rd
- 00 Brdecka Ln
- 0 Brdecka Ln
- 3819 Cottonwood School Rd
- 5023 McKinney Ridge Trail
- 710 Walnut Branch Dr
- 5034 McKinney Ridge Trail
- 5038 McKinney Ridge Trail
- 4906 Benton Woods Trail
- 4911 Benton Woods Trail
- 615 Roland Ln
- 5122 McKinney Ridge Trail
- 4915 Benton Woods Trail
- 2020 Finney Vallet Rd
- 2017 Finney Vallet Rd
- 2110 Finney Vallet Rd
- 5119 Zunker Rd
- 2007 Finney Vallet Rd
- 2112 Finney Vallet Rd
- 4925 Sims Rd
- 2109 Finney Vallet Rd
- 4913 Sims Rd
- 2103 Finney Vallet Rd
- 2118 Finney Vallet Rd
- 4903 Sims Rd
- 215 Twin Ln
- 125 Twin Ln
- 2220 Finney Vallet Rd
- 4857 Sims Rd
- 4853 Sims Rd
- 221 Twin Ln
- 4855 Sims Rd
- 301 Twin Ln
Your Personal Tour Guide
Ask me questions while you tour the home.