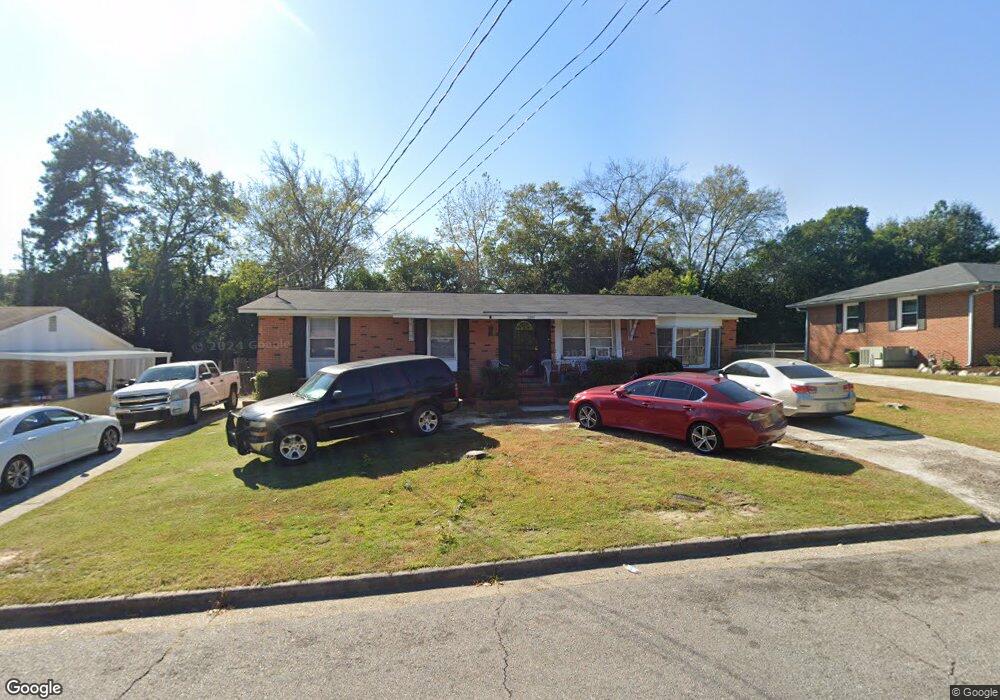
2006 Melrose Dr Augusta, GA 30906
Southside NeighborhoodEstimated Value: $164,000 - $188,000
3
Beds
2
Baths
1,716
Sq Ft
$101/Sq Ft
Est. Value
About This Home
This home is located at 2006 Melrose Dr, Augusta, GA 30906 and is currently estimated at $173,078, approximately $100 per square foot. 2006 Melrose Dr is a home located in Richmond County with nearby schools including Richmond Hill K-8, Johnson Magnet, and Butler High School.
Ownership History
Date
Name
Owned For
Owner Type
Purchase Details
Closed on
Sep 4, 2001
Sold by
Admin Of Veterans Affairs
Bought by
Smith Cynthia V
Current Estimated Value
Purchase Details
Closed on
Feb 6, 2001
Sold by
Countrywide Home Loans Inc
Bought by
Va
Purchase Details
Closed on
Oct 7, 1997
Sold by
Love William G and Love Cheryl Ann
Bought by
Maxwell David A and Maxwell Cheri D
Home Financials for this Owner
Home Financials are based on the most recent Mortgage that was taken out on this home.
Original Mortgage
$65,178
Interest Rate
7.55%
Mortgage Type
VA
Purchase Details
Closed on
Oct 1, 1986
Sold by
Crook Michael E
Bought by
Love William G
Purchase Details
Closed on
Nov 1, 1984
Purchase Details
Closed on
Oct 1, 1982
Create a Home Valuation Report for This Property
The Home Valuation Report is an in-depth analysis detailing your home's value as well as a comparison with similar homes in the area
Home Values in the Area
Average Home Value in this Area
Purchase History
| Date | Buyer | Sale Price | Title Company |
|---|---|---|---|
| Smith Cynthia V | $78,600 | -- | |
| Va | -- | -- | |
| Countrywide Home Loans Inc | $59,929 | -- | |
| Admin Of Veterans Affairs | $59,900 | -- | |
| Maxwell David A | $63,900 | -- | |
| Love William G | $61,500 | -- | |
| -- | $42,500 | -- | |
| -- | $38,400 | -- |
Source: Public Records
Mortgage History
| Date | Status | Borrower | Loan Amount |
|---|---|---|---|
| Previous Owner | Maxwell David A | $65,178 |
Source: Public Records
Tax History
| Year | Tax Paid | Tax Assessment Tax Assessment Total Assessment is a certain percentage of the fair market value that is determined by local assessors to be the total taxable value of land and additions on the property. | Land | Improvement |
|---|---|---|---|---|
| 2025 | $2,231 | $63,732 | $6,400 | $57,332 |
| 2024 | $2,231 | $74,328 | $6,400 | $67,928 |
| 2023 | $1,662 | $67,868 | $6,400 | $61,468 |
| 2022 | $1,678 | $46,376 | $6,400 | $39,976 |
| 2021 | $1,788 | $46,258 | $6,400 | $39,858 |
| 2020 | $1,764 | $46,258 | $6,400 | $39,858 |
| 2019 | $1,855 | $46,258 | $6,400 | $39,858 |
| 2018 | $1,866 | $46,258 | $6,400 | $39,858 |
| 2017 | $1,661 | $41,756 | $6,400 | $35,356 |
| 2016 | $1,662 | $41,756 | $6,400 | $35,356 |
| 2015 | $1,716 | $41,756 | $6,400 | $35,356 |
| 2014 | $1,673 | $41,756 | $6,400 | $35,356 |
Source: Public Records
Map
Nearby Homes
- 2106 Cadden Rd
- 1809 Formosa Dr
- 3341 Fashion Dr
- 3330 Fashion Dr
- 2150 Cadden Rd
- 1932 Satcher Blvd
- 1912 Elizabeth Dr
- 3606 Old Ironsides Blvd
- 3404 Sutton Place
- 1922 Elizabeth Dr
- 3417 Rushing Rd
- 3412 Sutton Place
- 3414 Sutton Place
- 3428 Rushing Rd
- 2211 Mura Dr
- 2019 Dunham Ct
- 3438 Rushing Rd
- 2147 Alfred Ln
- 2143 Reedale Ave
- 2101 Rosier Rd
- 2004 Melrose Dr
- 2008 Melrose Dr
- 2002 Melrose Dr
- 2010 Melrose Dr
- 2003 Melrose Dr
- 2005 Melrose Dr
- 2610 Tobin St
- 2858 Tobin St
- 2007 Melrose Dr
- 3338 Peach Orchard Rd
- 2012 Melrose Dr
- 2009 Melrose Dr
- 1921 Melrose Dr
- 2002 Denmark Dr
- 2011 Melrose Dr
- 3322 Tobin St
- 2014 Melrose Dr
- 1916 Melrose Dr
- 2006 Denmark Dr
- 3321 Tobin St
Your Personal Tour Guide
Ask me questions while you tour the home.