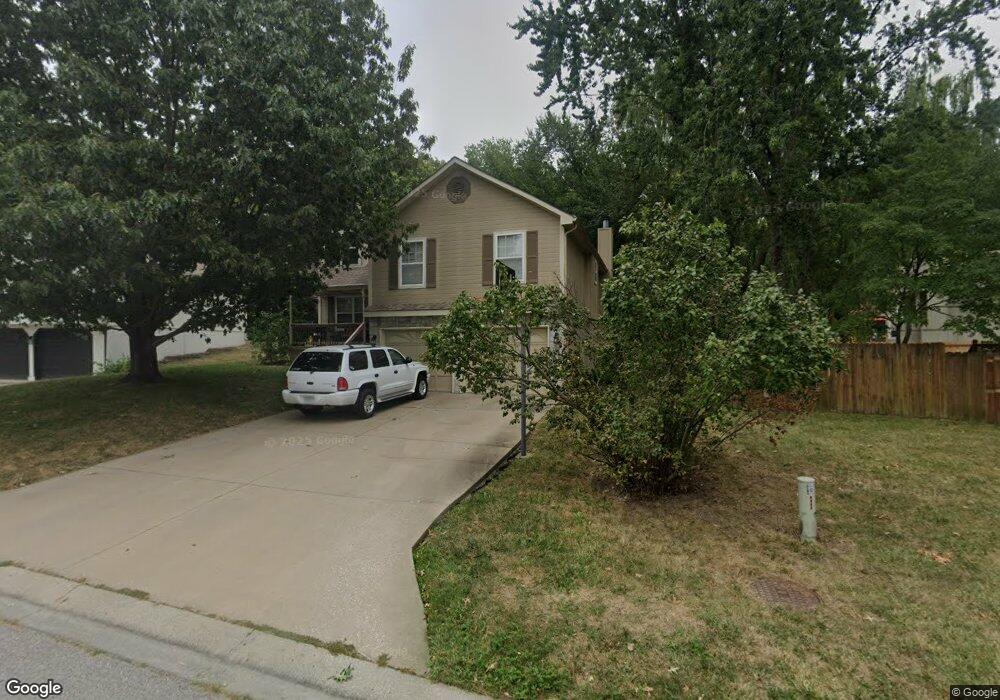
2006 NE 3rd St Blue Springs, MO 64014
Estimated Value: $354,363 - $381,000
4
Beds
3
Baths
2,125
Sq Ft
$171/Sq Ft
Est. Value
About This Home
This home is located at 2006 NE 3rd St, Blue Springs, MO 64014 and is currently estimated at $363,091, approximately $170 per square foot. 2006 NE 3rd St is a home located in Jackson County with nearby schools including Lucy Franklin Elementary School, Brittany Hill Middle School, and Blue Springs High School.
Ownership History
Date
Name
Owned For
Owner Type
Purchase Details
Closed on
Jun 9, 2025
Sold by
Hobbs Gregory Todd
Bought by
Hobbs Ronda Sue
Current Estimated Value
Purchase Details
Closed on
Jun 16, 1998
Sold by
Cathy Eshleman Phillip Michael
Bought by
Hobbs Gregory T and Hobbs Ronda S
Home Financials for this Owner
Home Financials are based on the most recent Mortgage that was taken out on this home.
Original Mortgage
$113,900
Interest Rate
7.21%
Mortgage Type
Purchase Money Mortgage
Purchase Details
Closed on
May 16, 1996
Sold by
Robert A Washam Construction Inc
Bought by
Eshleman Phillip Michael and Eshleman Cathy
Home Financials for this Owner
Home Financials are based on the most recent Mortgage that was taken out on this home.
Original Mortgage
$123,930
Interest Rate
8.5%
Mortgage Type
VA
Purchase Details
Closed on
Aug 10, 1995
Sold by
Parker Jones Development Company
Bought by
Robert A Washam Construction Inc
Home Financials for this Owner
Home Financials are based on the most recent Mortgage that was taken out on this home.
Original Mortgage
$94,000
Interest Rate
7.58%
Mortgage Type
Construction
Create a Home Valuation Report for This Property
The Home Valuation Report is an in-depth analysis detailing your home's value as well as a comparison with similar homes in the area
Home Values in the Area
Average Home Value in this Area
Purchase History
| Date | Buyer | Sale Price | Title Company |
|---|---|---|---|
| Hobbs Ronda Sue | -- | None Listed On Document | |
| Hobbs Gregory T | -- | -- | |
| Eshleman Phillip Michael | -- | -- | |
| Robert A Washam Construction Inc | -- | Ati Title Company |
Source: Public Records
Mortgage History
| Date | Status | Borrower | Loan Amount |
|---|---|---|---|
| Previous Owner | Hobbs Gregory T | $113,900 | |
| Previous Owner | Eshleman Phillip Michael | $123,930 | |
| Previous Owner | Robert A Washam Construction Inc | $94,000 |
Source: Public Records
Tax History Compared to Growth
Tax History
| Year | Tax Paid | Tax Assessment Tax Assessment Total Assessment is a certain percentage of the fair market value that is determined by local assessors to be the total taxable value of land and additions on the property. | Land | Improvement |
|---|---|---|---|---|
| 2025 | $4,339 | $55,782 | $7,087 | $48,695 |
| 2024 | $4,339 | $53,187 | $7,598 | $45,589 |
| 2023 | $4,256 | $53,187 | $6,090 | $47,097 |
| 2022 | $3,819 | $42,180 | $5,294 | $36,886 |
| 2021 | $3,815 | $42,180 | $5,294 | $36,886 |
| 2020 | $3,507 | $39,438 | $5,294 | $34,144 |
| 2019 | $3,391 | $39,438 | $5,294 | $34,144 |
| 2018 | $3,066 | $34,323 | $4,607 | $29,716 |
| 2017 | $2,932 | $34,323 | $4,607 | $29,716 |
| 2016 | $2,932 | $32,908 | $5,092 | $27,816 |
| 2014 | $2,763 | $30,916 | $5,086 | $25,830 |
Source: Public Records
Map
Nearby Homes
- 311 NE Bridge Place
- 404 NE Lee Dr
- 1914 NE Grant Cir
- 517 NE Johnston Dr
- 420 NE Golfview Dr
- 105 NE Leann Dr
- 1912 NW Manor Dr
- 280 NW Beau Dr
- 2012 NE Adams Dairy Rd
- 816 NE Mary Ct
- 204 NW Golfview Dr
- 2400 NW 1st St
- 2515 NE Springbrook St
- 1800 NE Waterfield Village Ct
- 1001 NE Wien Ave
- 2323 NW Acorn Dr
- 2105 NW 5th St
- 1200 NE Crestview Dr
- 516 NW Brett Cir
- 2615 NE Springbrook St
- 2010 NE 3rd St
- 2002 NE 3rd St
- 307 NE Bridge Place
- 2014 NE 3rd St
- 2001 NE 4th St
- 1917 NE 4th St
- 2005 NE 4th St
- 1913 NE 4th St
- 2007 NE 3rd St
- 227 NE Bridge Place
- 2011 NE 3rd St
- 2016 NE 3rd St
- 2009 NE 4th St
- 1909 NE 4th St
- 310 NE Bridge Place
- 2013 NE 4th St
- 223 NE Bridge Place
- 302 NE Bridge Place
- 204 NE Thames Ct
- 306 NE Bridge Place