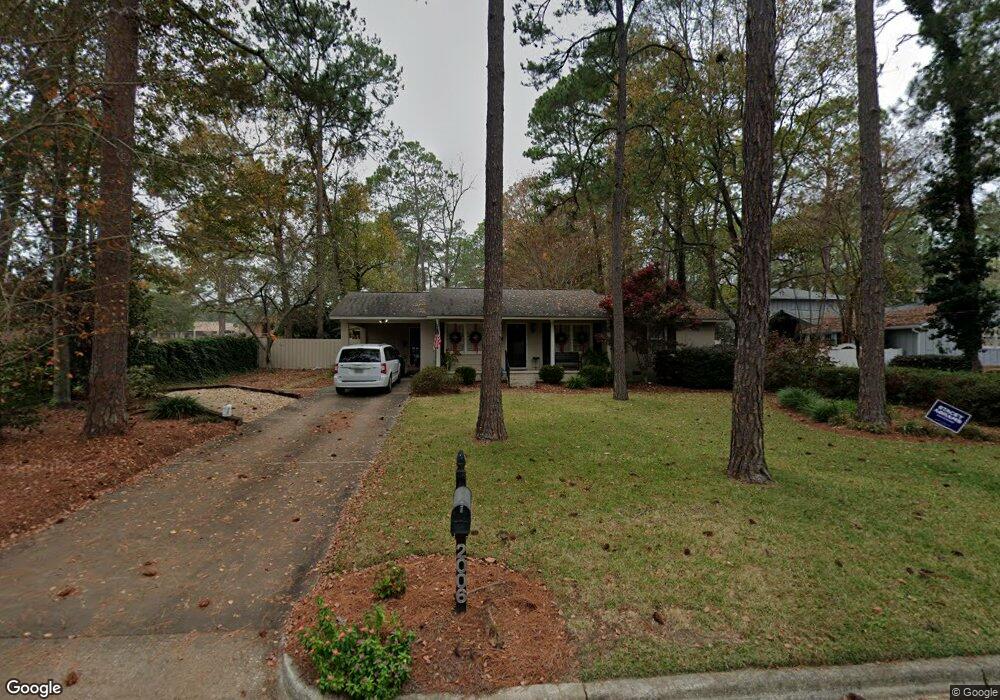
2006 Park Ave N Tifton, GA 31794
Estimated Value: $223,259 - $243,000
3
Beds
2
Baths
1,988
Sq Ft
$117/Sq Ft
Est. Value
About This Home
This home is located at 2006 Park Ave N, Tifton, GA 31794 and is currently estimated at $233,565, approximately $117 per square foot. 2006 Park Ave N is a home located in Tift County with nearby schools including Len Lastinger Primary School, Charles Spencer Elementary School, and J.T. Reddick School.
Ownership History
Date
Name
Owned For
Owner Type
Purchase Details
Closed on
Feb 14, 2018
Sold by
Howell Courtney W
Bought by
Smith Tayor M
Current Estimated Value
Home Financials for this Owner
Home Financials are based on the most recent Mortgage that was taken out on this home.
Original Mortgage
$159,556
Outstanding Balance
$134,720
Interest Rate
3.87%
Mortgage Type
FHA
Estimated Equity
$98,845
Purchase Details
Closed on
Apr 19, 2010
Sold by
Lawrence Harriett G
Bought by
Howell Courtney W and Howell Amy K
Home Financials for this Owner
Home Financials are based on the most recent Mortgage that was taken out on this home.
Original Mortgage
$152,040
Interest Rate
4.94%
Mortgage Type
New Conventional
Purchase Details
Closed on
Feb 3, 2000
Sold by
Henderson Harold Paulk
Bought by
Lawrence Harriett G
Purchase Details
Closed on
Mar 21, 1991
Bought by
Henderson Harold Paulk
Create a Home Valuation Report for This Property
The Home Valuation Report is an in-depth analysis detailing your home's value as well as a comparison with similar homes in the area
Home Values in the Area
Average Home Value in this Area
Purchase History
| Date | Buyer | Sale Price | Title Company |
|---|---|---|---|
| Smith Tayor M | $162,500 | -- | |
| Howell Courtney W | $146,000 | -- | |
| Lawrence Harriett G | $110,000 | -- | |
| Henderson Harold Paulk | -- | -- |
Source: Public Records
Mortgage History
| Date | Status | Borrower | Loan Amount |
|---|---|---|---|
| Open | Smith Tayor M | $159,556 | |
| Previous Owner | Howell Courtney W | $152,040 |
Source: Public Records
Tax History Compared to Growth
Tax History
| Year | Tax Paid | Tax Assessment Tax Assessment Total Assessment is a certain percentage of the fair market value that is determined by local assessors to be the total taxable value of land and additions on the property. | Land | Improvement |
|---|---|---|---|---|
| 2024 | $1,837 | $68,136 | $8,000 | $60,136 |
| 2023 | $1,953 | $55,057 | $6,000 | $49,057 |
| 2022 | $2,072 | $55,057 | $6,000 | $49,057 |
| 2021 | $2,085 | $55,057 | $6,000 | $49,057 |
| 2020 | $1,782 | $45,913 | $6,000 | $39,913 |
| 2019 | $1,783 | $45,913 | $6,000 | $39,913 |
| 2018 | $1,628 | $45,913 | $6,000 | $39,913 |
| 2017 | $1,672 | $45,913 | $6,000 | $39,913 |
| 2016 | $1,674 | $45,913 | $6,000 | $39,913 |
| 2015 | $1,677 | $45,913 | $6,000 | $39,913 |
| 2014 | $1,679 | $45,913 | $6,000 | $39,913 |
| 2013 | -- | $45,912 | $6,000 | $39,912 |
Source: Public Records
Map
Nearby Homes
- 2214 Love Ave
- 1617 Wilson Ave N
- 0 Central Ave Unit 138182
- 0 Central Ave Unit 137897
- 0 Central Ave Unit 137896
- 0 Central Ave Unit 137898
- 0 Central Ave Unit 137895
- 1611 Love Ave
- 1601 Murray Ave
- 2021 Emory Dr
- 0 Tift Ave
- 2202 Emory Dr
- 502 20th St E
- 2609 Emmett Dr
- 15 acres Us Highway 41
- 33.7 ac Us Highway 41
- 48 acres Us Highway 41
- 705 20th St E
- 2020 Davis Ave
- 1809 Davis Ave
- 2002 Park Ave N
- 2014 Park Ave N
- 211 20th St W
- 2005 Ridge Ave N
- 2007 Ridge Ave N
- 2005 Park Ave N
- 1824 Park Ave N
- 2003 Park Ave N
- 2011 Park Ave N
- 215 20th St W
- 2015 Ridge Ave N
- 2018 Park Ave N
- 2015 Park Ave N
- 0 Ridge Ave N Unit 7605117
- 2009 Ridge Ave N
- 112 20th St W
- 2022 Park Ave N
- 1822 Park Ave N
- 2019 Park Ave N
- 110 20th St W