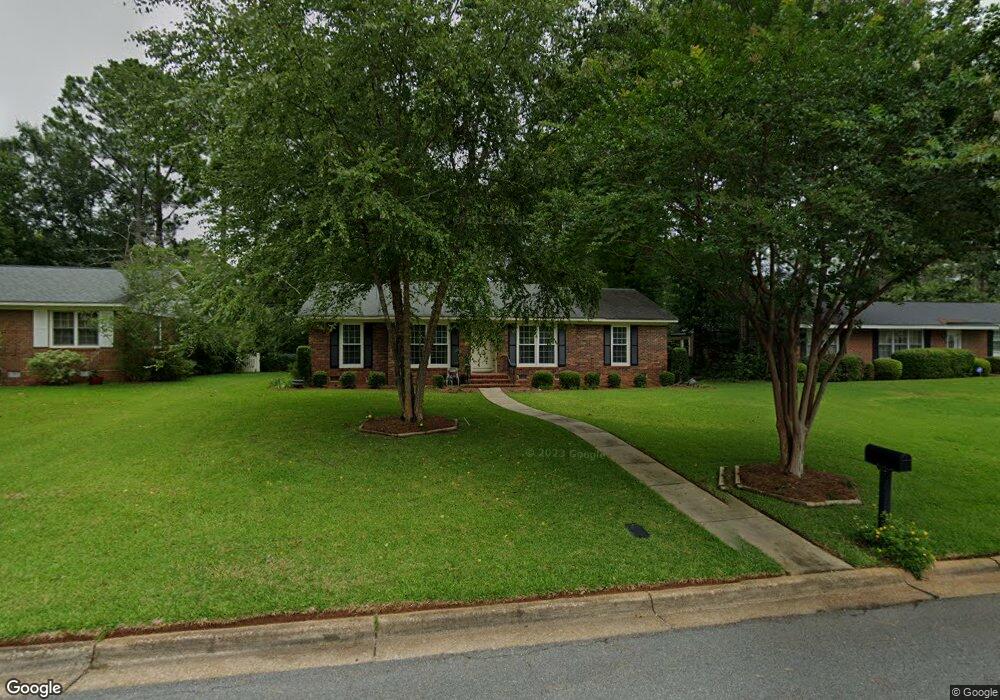
2006 Robinhood Rd Albany, GA 31707
Lake Park NeighborhoodEstimated Value: $177,035 - $196,000
3
Beds
2
Baths
1,588
Sq Ft
$119/Sq Ft
Est. Value
About This Home
This home is located at 2006 Robinhood Rd, Albany, GA 31707 and is currently estimated at $188,259, approximately $118 per square foot. 2006 Robinhood Rd is a home located in Dougherty County with nearby schools including Lake Park Elementary School, Merry Acres Middle School, and Westover High School.
Ownership History
Date
Name
Owned For
Owner Type
Purchase Details
Closed on
Jul 7, 2006
Sold by
Haywood Tina
Bought by
Abell Cheryl
Current Estimated Value
Home Financials for this Owner
Home Financials are based on the most recent Mortgage that was taken out on this home.
Original Mortgage
$100,720
Outstanding Balance
$59,431
Interest Rate
6.54%
Mortgage Type
New Conventional
Estimated Equity
$128,828
Purchase Details
Closed on
Aug 1, 2003
Sold by
Bolivar Rene' Charles
Bought by
Haywood Tina G
Purchase Details
Closed on
Aug 29, 2001
Sold by
Bolivar Leah E Hancock
Bought by
Bolivar Rene' Charles
Purchase Details
Closed on
Nov 15, 1996
Sold by
Kirkley James J and Kirkley Anamae S
Bought by
Bolivar Leah E and Rene' Charles
Purchase Details
Closed on
Dec 29, 1995
Sold by
Jones Robert J Sr By Exec U/Will & Heirs
Bought by
Kirkley James J and Kirkley Anamae S
Purchase Details
Closed on
Dec 29, 1964
Sold by
Reeves Troy M
Bought by
Jones Robt and Jones Marjori
Create a Home Valuation Report for This Property
The Home Valuation Report is an in-depth analysis detailing your home's value as well as a comparison with similar homes in the area
Home Values in the Area
Average Home Value in this Area
Purchase History
| Date | Buyer | Sale Price | Title Company |
|---|---|---|---|
| Abell Cheryl | $125,900 | -- | |
| Haywood Tina G | $103,800 | -- | |
| Bolivar Rene' Charles | -- | -- | |
| Bolivar Leah E | $81,000 | -- | |
| Kirkley James J | $75,400 | -- | |
| Jones Robt | -- | -- |
Source: Public Records
Mortgage History
| Date | Status | Borrower | Loan Amount |
|---|---|---|---|
| Open | Abell Cheryl | $100,720 |
Source: Public Records
Tax History Compared to Growth
Tax History
| Year | Tax Paid | Tax Assessment Tax Assessment Total Assessment is a certain percentage of the fair market value that is determined by local assessors to be the total taxable value of land and additions on the property. | Land | Improvement |
|---|---|---|---|---|
| 2024 | $1,878 | $39,360 | $7,200 | $32,160 |
| 2023 | $1,834 | $39,360 | $7,200 | $32,160 |
| 2022 | $1,841 | $39,360 | $7,200 | $32,160 |
| 2021 | $1,706 | $39,360 | $7,200 | $32,160 |
| 2020 | $1,710 | $39,360 | $7,200 | $32,160 |
| 2019 | $1,717 | $39,360 | $7,200 | $32,160 |
| 2018 | $1,724 | $39,360 | $7,200 | $32,160 |
| 2017 | $1,606 | $39,360 | $7,200 | $32,160 |
| 2016 | $1,607 | $39,360 | $7,200 | $32,160 |
| 2015 | $1,611 | $39,360 | $7,200 | $32,160 |
| 2014 | $1,664 | $41,160 | $9,000 | $32,160 |
Source: Public Records
Map
Nearby Homes
- 2012 W Lakeridge Dr
- 1009 Summit Dr
- 1021 Summit Dr
- 1911 Lynwood Ln
- 1826 Green Valley Ln
- 1812 Robinhood Rd
- 2506 Ridgewood Ln
- 1802 W Lakeridge Dr
- 418 Meadowlark Dr
- 2205 Star Ln
- 2508 Pheasant Dr
- 1814 Green Valley Ln
- 510 Flamingo Ln
- 1807 Pineknoll Ln
- 1728 Lynwood Ln
- 1805 Pineknoll Ln
- 2316 Pembroke Dr
- 1721 Lynwood Ln
- 2304 Tuxedo Ln
- 427 S Audubon Dr
- 2008 Robinhood Rd
- 2004 Robinhood Rd
- 2010 Robinhood Rd
- 2002 Robinhood Rd
- 2006 W Lakeridge Dr
- 2008 W Lakeridge Dr
- 2007 Robinhood Rd
- 2005 Robinhood Rd
- 2004 W Lakeridge Dr
- 2009 Robinhood Rd
- 2012 Robinhood Rd
- 2010 W Lakeridge Dr
- 2000 Robinhood Rd
- 2003 Robinhood Rd
- 2002 W Lakeridge Dr
- 2011 Robinhood Rd
- 2014 Robinhood Rd
- 2013 Robinhood Rd
- 2000 W Lakeridge Dr
- 2006 Lullwater Rd