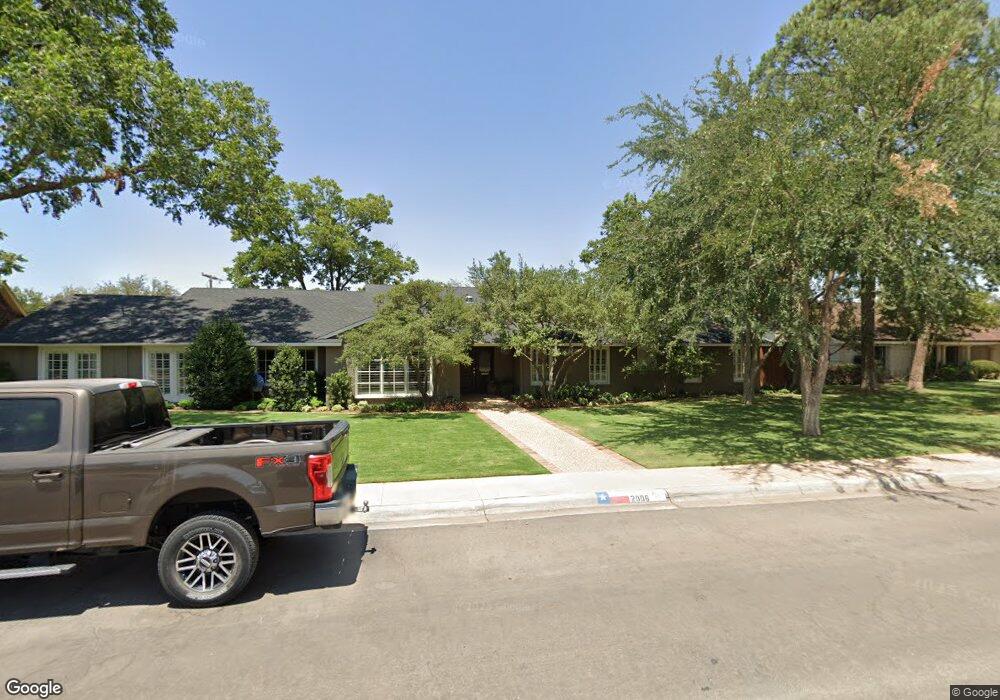
2006 Seaboard Ave Midland, TX 79705
Estimated Value: $605,000 - $2,410,558
4
Beds
4
Baths
4,916
Sq Ft
$275/Sq Ft
Est. Value
About This Home
This home is located at 2006 Seaboard Ave, Midland, TX 79705 and is currently estimated at $1,354,186, approximately $275 per square foot. 2006 Seaboard Ave is a home located in Midland County with nearby schools including Fannin Elementary School, Midland High School, and The Hillander School.
Ownership History
Date
Name
Owned For
Owner Type
Purchase Details
Closed on
Apr 17, 2024
Sold by
Hudson Alicia and Hudson Seth
Bought by
Horton Robert and Horton Allyse
Current Estimated Value
Purchase Details
Closed on
Jul 12, 2021
Sold by
Robnett Stephen W and Robnett Amy D
Bought by
Hudson Seth and Hudson Alicia
Purchase Details
Closed on
Oct 30, 2019
Sold by
Hudson Alicia
Bought by
Hudson Seth
Purchase Details
Closed on
Mar 21, 2016
Sold by
Wheelis Wayne M and Wheelis Wendy F
Bought by
Hudson Alicia
Purchase Details
Closed on
Jun 15, 2011
Sold by
Grubb Dennis D and Grubb Cynthia
Bought by
Wheelis Wayne M and Wheelis Wendy F
Purchase Details
Closed on
Apr 3, 2001
Sold by
Semple Charles A
Bought by
Hudson Alicia
Purchase Details
Closed on
Apr 11, 1973
Bought by
Hudson Alicia
Create a Home Valuation Report for This Property
The Home Valuation Report is an in-depth analysis detailing your home's value as well as a comparison with similar homes in the area
Home Values in the Area
Average Home Value in this Area
Purchase History
| Date | Buyer | Sale Price | Title Company |
|---|---|---|---|
| Horton Robert | -- | West Texas Abstract & Title | |
| Hudson Seth | -- | Permian Abstract Company | |
| Hudson Seth | -- | None Available | |
| Hudson Alicia | -- | None Available | |
| Wheelis Wayne M | -- | Lone Star Abstract & Title C | |
| Hudson Alicia | -- | -- | |
| Hudson Alicia | -- | -- |
Source: Public Records
Tax History Compared to Growth
Tax History
| Year | Tax Paid | Tax Assessment Tax Assessment Total Assessment is a certain percentage of the fair market value that is determined by local assessors to be the total taxable value of land and additions on the property. | Land | Improvement |
|---|---|---|---|---|
| 2025 | $11,782 | $869,840 | $63,180 | $806,660 |
| 2024 | $11,800 | $888,420 | $63,180 | $825,240 |
| 2023 | $12,939 | $863,410 | $63,180 | $800,230 |
| 2022 | $13,043 | $834,790 | $63,180 | $771,610 |
| 2021 | $14,064 | $834,790 | $63,180 | $771,610 |
| 2020 | $12,719 | $790,580 | $63,180 | $727,400 |
| 2019 | $12,631 | $667,180 | $63,180 | $727,400 |
| 2018 | $11,793 | $606,530 | $63,180 | $679,620 |
| 2017 | $10,721 | $551,390 | $63,180 | $488,210 |
| 2016 | $10,613 | $544,830 | $63,180 | $481,650 |
| 2015 | -- | $544,830 | $63,180 | $481,650 |
| 2014 | -- | $522,450 | $63,180 | $459,270 |
Source: Public Records
Map
Nearby Homes
- 2000 Neely Ave
- 2609 Mcclintic St
- 2603 Hodges St
- 2016 Gulf Prairie Ln
- 1611 W Pecan Ave
- 2704 N L St
- 2207 Raleigh Point Dr
- 2205 Cimmaron Ave
- 1602 Winfield Rd
- 2109 Western Dr
- 1901 N Garfield St
- 1606 Shell Ave
- 2202 Western Dr
- 1607 Shell Ave
- 1605 Shell Ave
- 2207 Boyd Ave
- 2105 Oaklawn Dr
- 2400 W Dengar Ave
- 1209 W Pecan Ave
- 1608 N L St
- 2008 Seaboard Ave
- 2004 Seaboard Ave
- 2009 Neely Ave
- 2007 Neely Ave
- 2011 Neely Ave
- 2007 Seaboard Ave
- 2005 Neely Ave
- 2207 Winfield Rd
- 2002 Seaboard Ave
- 2005 Seaboard Ave
- 2100 Seaboard Ave
- 2003 Neely Ave
- 2205 Winfield Rd
- 2003 Seaboard Ave
- 2006 Stanolind Ave
- 2004 Stanolind Ave
- 2103 Seaboard Ave
- 2000 Seaboard Ave
- 2303 Northern Ln
- 2209 Northern Ln