Estimated payment $1,211/month
Highlights
- No HOA
- Soaking Tub
- Patio
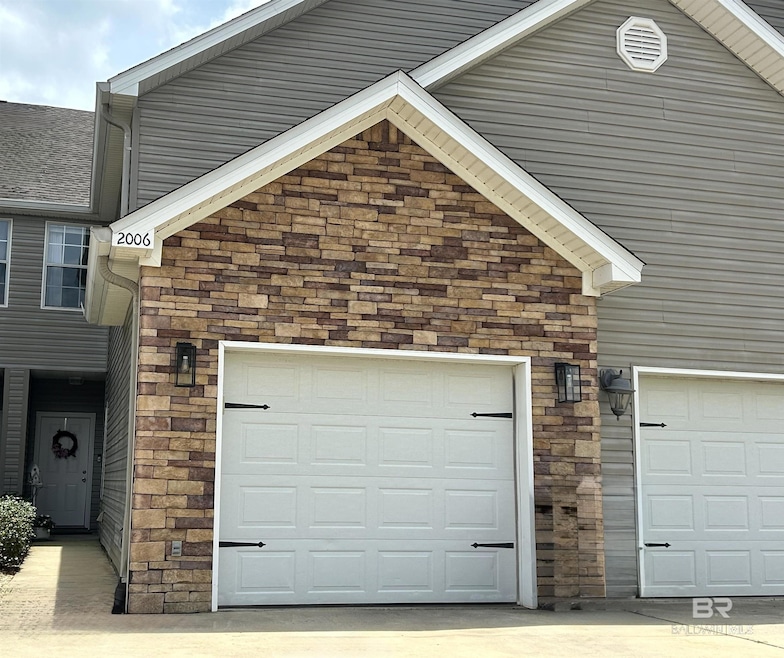
- Attached Garage
- Views
- Tile Flooring
About This Home
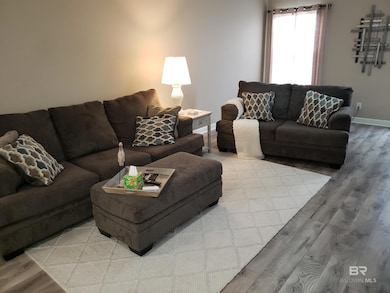
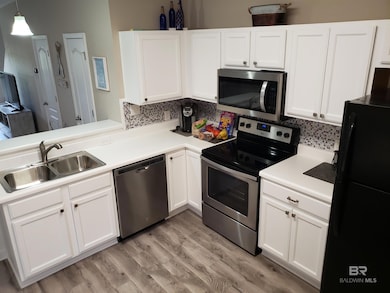
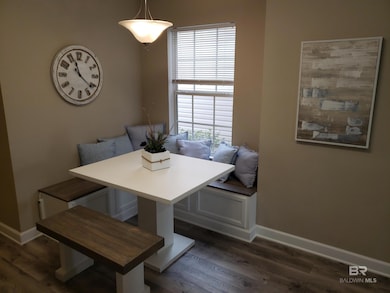
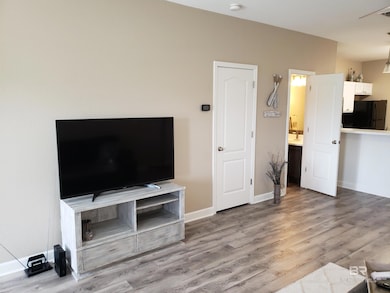
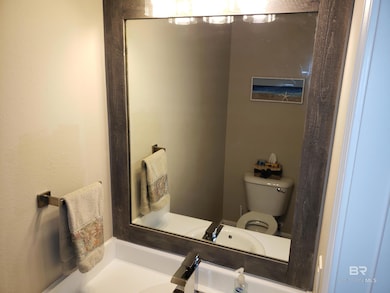
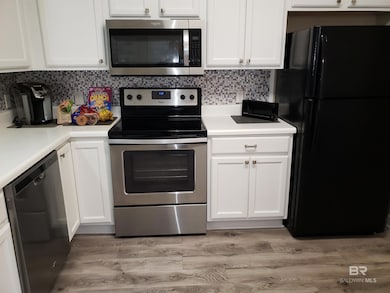
$28k below County Appraisal Value!!! Totally Upgraded and Move in Ready including Furnishings. Kitchen Appliances and Washer & Dryer. Great Single Family Townhome in gated Shadow Lakes Community with Garage and Upgrades Galore. Great Location Near Restaurants, Outlet Mall, OWA, Wal-Mart, Ball Fields, Everything & only 9 miles to the Gulf Shores Public Beach. *Short Term Vacation or Long Term Rentals allowed. NO HOA! No Lawncare! New Roof, New A/C, LVP Flooring in Living and Kitchen plus much more. See Documents for complete list of improvements and dates. Owner has put much TLC into this home and is in Excellent Condition. Don't miss out on this Great Deal in the heart of Foley, AL Buyer to verify all information during due diligence.
Townhouse Details
Home Type
- Townhome
Est. Annual Taxes
- $764
Year Built
- Built in 2008
Lot Details
- 1,002 Sq Ft Lot
- South Facing Home
- Landscaped
Home Design
- Slab Foundation
- Wood Frame Construction
- Composition Roof
- Vinyl Siding
Interior Spaces
- 1,633 Sq Ft Home
- 2-Story Property
- Furnished or left unfurnished upon request
- Ceiling Fan
- Window Treatments
- Property Views
Kitchen
- Electric Range
- Microwave
- Dishwasher
- Disposal
Flooring
- Carpet
- Tile
Bedrooms and Bathrooms
- 3 Bedrooms
- Primary bedroom located on second floor
- Dual Vanity Sinks in Primary Bathroom
- Soaking Tub
- Separate Shower
Laundry
- Laundry on lower level
- Dryer
- Washer
Home Security
Parking
- Attached Garage
- Automatic Garage Door Opener
Outdoor Features
- Patio
Schools
- Foley Elementary School
- Foley Middle School
- Foley High School
Utilities
- Central Heating and Cooling System
- Internet Available
- Cable TV Available
Listing and Financial Details
- Assessor Parcel Number 6103054001015.015
Community Details
Pet Policy
- Limit on the number of pets
Additional Features
- No Home Owners Association
- Fire and Smoke Detector
Map
Home Values in the Area
Average Home Value in this Area
Tax History
| Year | Tax Paid | Tax Assessment Tax Assessment Total Assessment is a certain percentage of the fair market value that is determined by local assessors to be the total taxable value of land and additions on the property. | Land | Improvement |
|---|---|---|---|---|
| 2024 | $764 | $23,140 | $3,760 | $19,380 |
| 2023 | $714 | $21,640 | $1,420 | $20,220 |
| 2022 | $603 | $18,260 | $0 | $0 |
| 2021 | $551 | $16,520 | $0 | $0 |
| 2020 | $523 | $15,840 | $0 | $0 |
| 2019 | $1,009 | $30,580 | $0 | $0 |
| 2018 | $976 | $29,580 | $0 | $0 |
| 2017 | $935 | $28,340 | $0 | $0 |
| 2016 | $883 | $26,760 | $0 | $0 |
| 2015 | $873 | $26,460 | $0 | $0 |
| 2014 | $811 | $24,580 | $0 | $0 |
| 2013 | -- | $23,360 | $0 | $0 |
Property History
| Date | Event | Price | List to Sale | Price per Sq Ft | Prior Sale |
|---|---|---|---|---|---|
| 09/26/2025 09/26/25 | Price Changed | $217,900 | -0.9% | $133 / Sq Ft | |
| 09/04/2025 09/04/25 | Price Changed | $219,900 | -2.2% | $135 / Sq Ft | |
| 08/08/2025 08/08/25 | Price Changed | $224,900 | -2.2% | $138 / Sq Ft | |
| 06/20/2025 06/20/25 | Price Changed | $229,900 | -2.1% | $141 / Sq Ft | |
| 06/06/2025 06/06/25 | Price Changed | $234,900 | -2.1% | $144 / Sq Ft | |
| 04/24/2025 04/24/25 | Price Changed | $239,900 | -4.0% | $147 / Sq Ft | |
| 03/17/2025 03/17/25 | For Sale | $249,900 | +99.9% | $153 / Sq Ft | |
| 05/31/2019 05/31/19 | Sold | $125,000 | -7.3% | $77 / Sq Ft | View Prior Sale |
| 04/24/2019 04/24/19 | Pending | -- | -- | -- | |
| 04/16/2019 04/16/19 | Price Changed | $134,800 | -0.1% | $83 / Sq Ft | |
| 04/12/2019 04/12/19 | Price Changed | $135,000 | -6.9% | $83 / Sq Ft | |
| 03/29/2019 03/29/19 | Price Changed | $145,000 | -0.7% | $89 / Sq Ft | |
| 03/18/2019 03/18/19 | Price Changed | $146,000 | -2.0% | $89 / Sq Ft | |
| 03/03/2019 03/03/19 | Price Changed | $149,000 | -0.6% | $91 / Sq Ft | |
| 02/11/2019 02/11/19 | Price Changed | $149,900 | -9.7% | $92 / Sq Ft | |
| 01/12/2019 01/12/19 | Price Changed | $166,000 | -0.6% | $102 / Sq Ft | |
| 01/03/2019 01/03/19 | Price Changed | $167,000 | -0.6% | $102 / Sq Ft | |
| 12/15/2018 12/15/18 | Price Changed | $168,000 | -0.2% | $103 / Sq Ft | |
| 12/03/2018 12/03/18 | Price Changed | $168,300 | -0.1% | $103 / Sq Ft | |
| 11/27/2018 11/27/18 | Price Changed | $168,500 | -0.3% | $103 / Sq Ft | |
| 11/09/2018 11/09/18 | Price Changed | $168,990 | -0.6% | $103 / Sq Ft | |
| 10/25/2018 10/25/18 | Price Changed | $169,990 | -99.9% | $104 / Sq Ft | |
| 10/25/2018 10/25/18 | For Sale | $169,990,000 | +226553.3% | $104,097 / Sq Ft | |
| 06/02/2014 06/02/14 | Sold | $75,000 | 0.0% | $46 / Sq Ft | View Prior Sale |
| 05/16/2014 05/16/14 | Pending | -- | -- | -- | |
| 01/28/2014 01/28/14 | For Sale | $75,000 | -- | $46 / Sq Ft |
Purchase History
| Date | Type | Sale Price | Title Company |
|---|---|---|---|
| Warranty Deed | $125,000 | None Available | |
| Special Warranty Deed | $75,000 | Ct | |
| Foreclosure Deed | $112,250 | None Available | |
| Warranty Deed | $114,953 | Slt |
Mortgage History
| Date | Status | Loan Amount | Loan Type |
|---|---|---|---|
| Open | $75,000 | New Conventional | |
| Previous Owner | $111,453 | Purchase Money Mortgage |
Source: Baldwin REALTORS®
MLS Number: 375854
APN: 61-03-05-4-001-015.015
Disclaimer: Certain information contained herein is derived from information provided by parties other than Homes.com. All information provided is deemed reliable, but is not guaranteed to be accurate and should be independently verified.
![]() IDX information is provided exclusively for personal, non-commercial use, and may not be used for any purpose other than to identify prospective properties consumers may be interested in purchasing. Information is deemed reliable but not guaranteed.
IDX information is provided exclusively for personal, non-commercial use, and may not be used for any purpose other than to identify prospective properties consumers may be interested in purchasing. Information is deemed reliable but not guaranteed.
- 450 Park Ave Unit 209
- 450 Park Ave Unit 112
- 450 Park Ave Unit 202
- 450 Park Ave Unit 305
- 450 Park Ave Unit 813
- 450 Park Ave Unit 812
- 450 Park Ave Unit 103
- 2701 Hampton Park Cir
- 3016 Meridian St
- 19445 Gray Horse Dr
- 19349 Gray Horse Dr
- 19331 Gray Horse Dr
- 19184 County Road 20
- 19323 Gray Horse Dr
- 19315 Gray Horse Dr
- 900 Sentinel Cir
- 909 Sentinel Cir
- 904 Sentinel Cir
- 19120 County Road 20
- 912 Sentinel Cir
- 2002 Shelene Way Unit 22DR
- 2800 Browning Way
- 9921 Bethany Dr
- 3293 Stratz Cir
- 9637 Soldier Horse Dr
- 8984 Impala Dr
- 3855 Stardust Dr
- 3151 Boulevard de Sevilla
- 2651 S Juniper St Unit 200
- 2651 S Juniper St Unit 1603
- 904 Shagbark Rd
- 9167 Hickory St S
- 1104 Hayward Loop
- 9815 James Rd
- 1045 Hayward Loop
- 3823 Chesterfield Ln
- 1802 Cashew Cir
- 1205 Sweet Laurel St
- 679 E Michigan Ave
- 1322 Allier Cir
