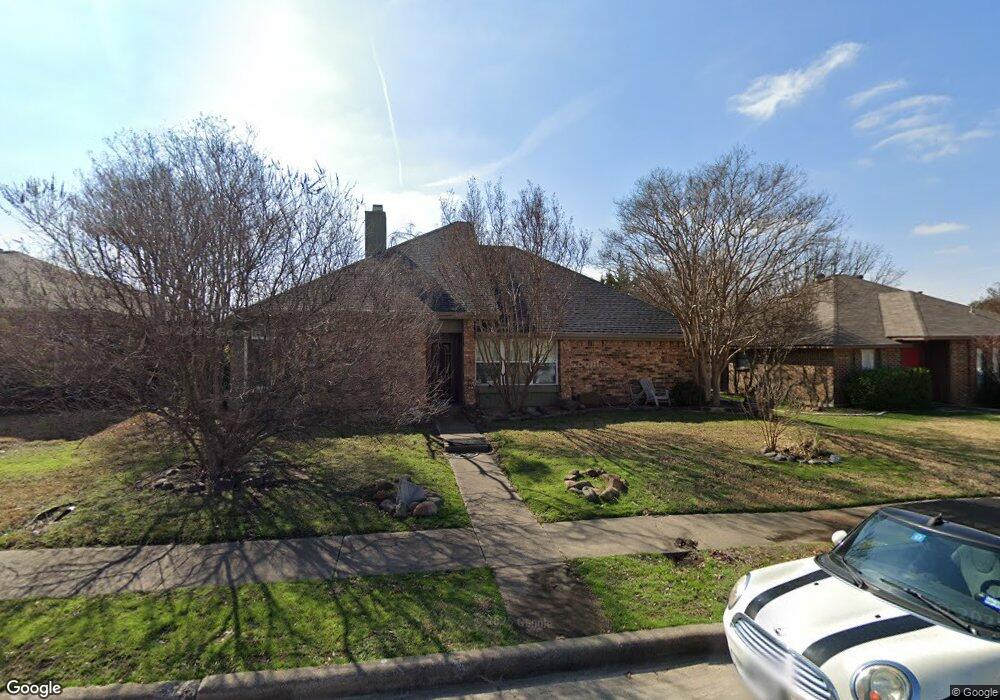
2006 Stein Way Carrollton, TX 75007
Northeast Carrollton NeighborhoodEstimated Value: $382,878 - $422,000
--
Bed
2
Baths
1,745
Sq Ft
$232/Sq Ft
Est. Value
About This Home
This home is located at 2006 Stein Way, Carrollton, TX 75007 and is currently estimated at $405,470, approximately $232 per square foot. 2006 Stein Way is a home located in Denton County with nearby schools including Homestead Elementary School, Arbor Creek Middle School, and Hebron High School.
Ownership History
Date
Name
Owned For
Owner Type
Purchase Details
Closed on
Apr 24, 2003
Sold by
Sidway David and Sidway Lisa
Bought by
Barrett Charlene A
Current Estimated Value
Home Financials for this Owner
Home Financials are based on the most recent Mortgage that was taken out on this home.
Original Mortgage
$131,900
Outstanding Balance
$55,914
Interest Rate
5.57%
Estimated Equity
$349,556
Purchase Details
Closed on
Jul 28, 1997
Sold by
Moore Samuel D
Bought by
Sidway David and Sidway Lisa
Home Financials for this Owner
Home Financials are based on the most recent Mortgage that was taken out on this home.
Original Mortgage
$103,000
Interest Rate
7.6%
Purchase Details
Closed on
Feb 23, 1994
Sold by
Futterman James Henry and Futterman Lori Helene Bloom
Bought by
Moore Samuel D
Home Financials for this Owner
Home Financials are based on the most recent Mortgage that was taken out on this home.
Original Mortgage
$92,150
Interest Rate
7%
Create a Home Valuation Report for This Property
The Home Valuation Report is an in-depth analysis detailing your home's value as well as a comparison with similar homes in the area
Home Values in the Area
Average Home Value in this Area
Purchase History
| Date | Buyer | Sale Price | Title Company |
|---|---|---|---|
| Barrett Charlene A | -- | -- | |
| Sidway David | -- | -- | |
| Moore Samuel D | -- | -- |
Source: Public Records
Mortgage History
| Date | Status | Borrower | Loan Amount |
|---|---|---|---|
| Open | Barrett Charlene A | $131,900 | |
| Previous Owner | Sidway David | $103,000 | |
| Previous Owner | Moore Samuel D | $92,150 |
Source: Public Records
Tax History Compared to Growth
Tax History
| Year | Tax Paid | Tax Assessment Tax Assessment Total Assessment is a certain percentage of the fair market value that is determined by local assessors to be the total taxable value of land and additions on the property. | Land | Improvement |
|---|---|---|---|---|
| 2025 | $2,528 | $378,036 | $93,184 | $284,852 |
| 2024 | $6,584 | $356,950 | $0 | $0 |
| 2023 | $2,432 | $324,500 | $93,184 | $292,763 |
| 2022 | $5,990 | $297,000 | $93,184 | $228,194 |
| 2021 | $5,831 | $270,000 | $57,344 | $212,656 |
| 2020 | $5,296 | $246,000 | $57,344 | $188,656 |
| 2019 | $5,325 | $239,000 | $57,344 | $181,656 |
| 2018 | $5,176 | $230,567 | $57,344 | $186,235 |
| 2017 | $4,762 | $209,606 | $57,344 | $173,874 |
| 2016 | $4,076 | $190,551 | $32,531 | $166,631 |
| 2015 | $3,308 | $173,228 | $32,531 | $150,292 |
| 2013 | -- | $154,003 | $32,531 | $121,472 |
Source: Public Records
Map
Nearby Homes
- 2017 Stein Way
- 3913 Alto Ave
- 2111 Stein Way
- 2025 Sancerre Ln
- 2115 Alto Ave
- 2008 E Branch Hollow Dr
- 3905 Furneaux Ln
- 1916 Avignon Ct
- 1920 Avignon Ct
- 3719 Canon Gate Cir
- 3701 Canon Gate Cir
- 3710 Woodside Rd
- 2028 Victoria Rd
- 1933 Oakbluff Dr
- 2302 Stone Glen Ln
- 1916 Middle Glen Dr
- 1940 Camden Way
- 2124 Lymington Rd
- 1926 Kensington Dr
- 3416 Livingston Ln
- 2004 Stein Way
- 2008 Stein Way
- 2002 Stein Way
- 2010 Stein Way
- 2007 Stradivarius Ln
- 2009 Stradivarius Ln
- 2005 Stradivarius Ln
- 2005 Stein Way
- 2003 Stein Way
- 2007 Stein Way
- 2011 Stradivarius Ln
- 2003 Stradivarius Ln
- 2012 Stein Way
- 2000 Stein Way
- 2001 Stein Way
- 2009 Stein Way
- 2013 Stradivarius Ln
- 2001 Stradivarius Ln
- 2011 Stein Way
- 2014 Stein Way