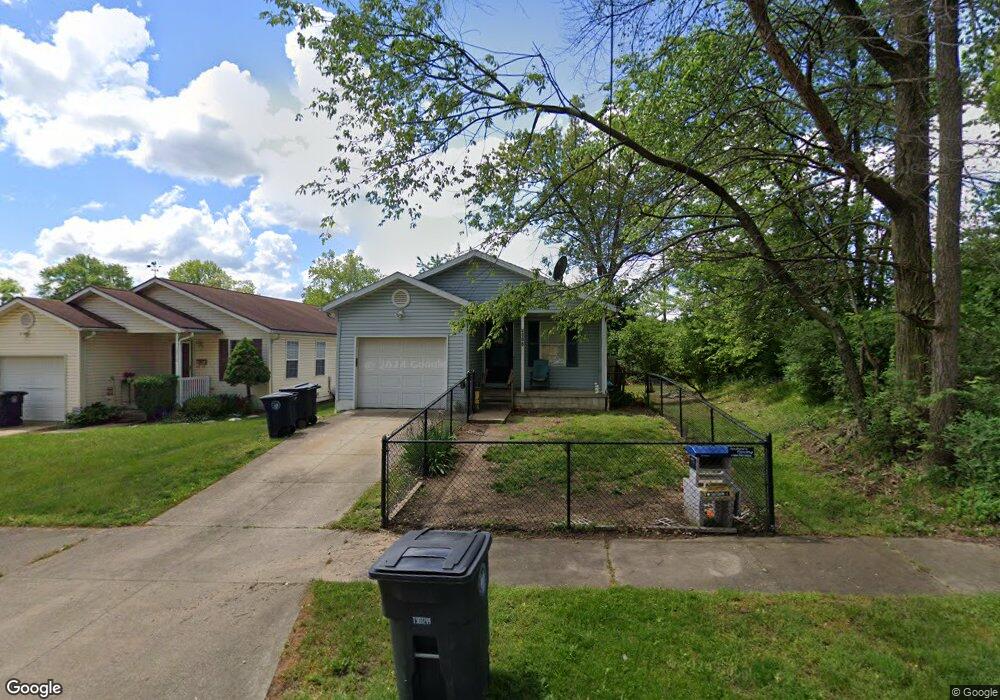
2006 Sycamore St Akron, OH 44301
Firestone Park NeighborhoodEstimated Value: $157,000 - $198,000
3
Beds
2
Baths
1,173
Sq Ft
$152/Sq Ft
Est. Value
About This Home
This home is located at 2006 Sycamore St, Akron, OH 44301 and is currently estimated at $177,976, approximately $151 per square foot. 2006 Sycamore St is a home located in Summit County with nearby schools including Kenmore Garfield Community Learning Center, Main Preparatory Academy, and Eagle Elementary.
Ownership History
Date
Name
Owned For
Owner Type
Purchase Details
Closed on
Aug 24, 2001
Sold by
Frame Spencer E and Frame Cindy L
Bought by
Jett Nora K
Current Estimated Value
Home Financials for this Owner
Home Financials are based on the most recent Mortgage that was taken out on this home.
Original Mortgage
$65,000
Outstanding Balance
$25,594
Interest Rate
7.28%
Estimated Equity
$152,382
Purchase Details
Closed on
Mar 6, 2001
Sold by
Mash Christine E
Bought by
Frame Spencer E and Frame Cindy L
Home Financials for this Owner
Home Financials are based on the most recent Mortgage that was taken out on this home.
Original Mortgage
$78,000
Interest Rate
7.18%
Purchase Details
Closed on
Jun 22, 1999
Sold by
Mash Doni A
Bought by
Mash Christine E
Purchase Details
Closed on
Dec 28, 1994
Sold by
Macaluso Anthony C
Bought by
Hoffman David A
Home Financials for this Owner
Home Financials are based on the most recent Mortgage that was taken out on this home.
Original Mortgage
$50,350
Interest Rate
9.24%
Mortgage Type
New Conventional
Create a Home Valuation Report for This Property
The Home Valuation Report is an in-depth analysis detailing your home's value as well as a comparison with similar homes in the area
Home Values in the Area
Average Home Value in this Area
Purchase History
| Date | Buyer | Sale Price | Title Company |
|---|---|---|---|
| Jett Nora K | $115,000 | Northeast Title Agency Inc | |
| Frame Spencer E | $18,000 | Northeast Title Agency Inc | |
| Mash Christine E | -- | Northeast Title Agency Inc | |
| Hoffman David A | $53,000 | -- |
Source: Public Records
Mortgage History
| Date | Status | Borrower | Loan Amount |
|---|---|---|---|
| Open | Jett Nora K | $65,000 | |
| Previous Owner | Frame Spencer E | $78,000 | |
| Previous Owner | Hoffman David A | $50,350 |
Source: Public Records
Tax History
| Year | Tax Paid | Tax Assessment Tax Assessment Total Assessment is a certain percentage of the fair market value that is determined by local assessors to be the total taxable value of land and additions on the property. | Land | Improvement |
|---|---|---|---|---|
| 2025 | $2,589 | $49,385 | $7,189 | $42,196 |
| 2024 | $2,589 | $49,385 | $7,189 | $42,196 |
| 2023 | $2,589 | $49,385 | $7,189 | $42,196 |
| 2022 | $2,348 | $35,123 | $5,100 | $30,023 |
| 2021 | $2,350 | $35,123 | $5,100 | $30,023 |
| 2020 | $2,314 | $35,120 | $5,100 | $30,020 |
| 2019 | $2,114 | $29,060 | $6,300 | $22,760 |
| 2018 | $2,085 | $29,060 | $6,300 | $22,760 |
| 2017 | $2,153 | $29,060 | $6,300 | $22,760 |
| 2016 | $2,154 | $29,540 | $6,300 | $23,240 |
| 2015 | $2,153 | $29,540 | $6,300 | $23,240 |
| 2014 | $2,135 | $29,540 | $6,300 | $23,240 |
| 2013 | $2,492 | $35,400 | $6,300 | $29,100 |
Source: Public Records
Map
Nearby Homes
- 41 W Woodsdale Ave
- 76 Clinton Ave
- 106 Selden Ave
- 30 Youtz Ave
- 75 W Dartmore Ave
- 14 E Dartmore Ave
- 2407 Nesmith Lake Blvd
- 29 E Dartmore Ave
- 36 W Wilbeth Rd
- 364 Rexford St
- 231 E Dresden Ave
- 127 Palmetto Ave
- 2255 Nesmith Lake Blvd
- 244 E Catawba Ave
- 2462 Edwin Ave
- 1835 Thornapple Ave
- 1595 Evergreen Ave
- 248 E Catawba Ave
- 2275 Edwin Ave
- 154 Crescent Dr
- 2010 Sycamore St
- 79 W Linwood Ave
- 75 W Linwood Ave
- 87 W Linwood Ave
- 2009 Sycamore St
- 2015 Sycamore St
- 89 W Linwood Ave Unit 91
- 89 W Linwood Ave Unit FRONT
- 60 W Dresden Ave
- Lot K W Linwood
- Lot J W Linwood
- 95 W Linwood Ave Unit 97
- 76 W Linwood Ave
- 55 W Linwood Ave
- 91 W Linwood Ave
- 51 W Linwood Ave
- 2034 Sycamore St
- 80 W Linwood Ave
- 88 W Linwood Ave
- 94 W Linwood Ave
Your Personal Tour Guide
Ask me questions while you tour the home.