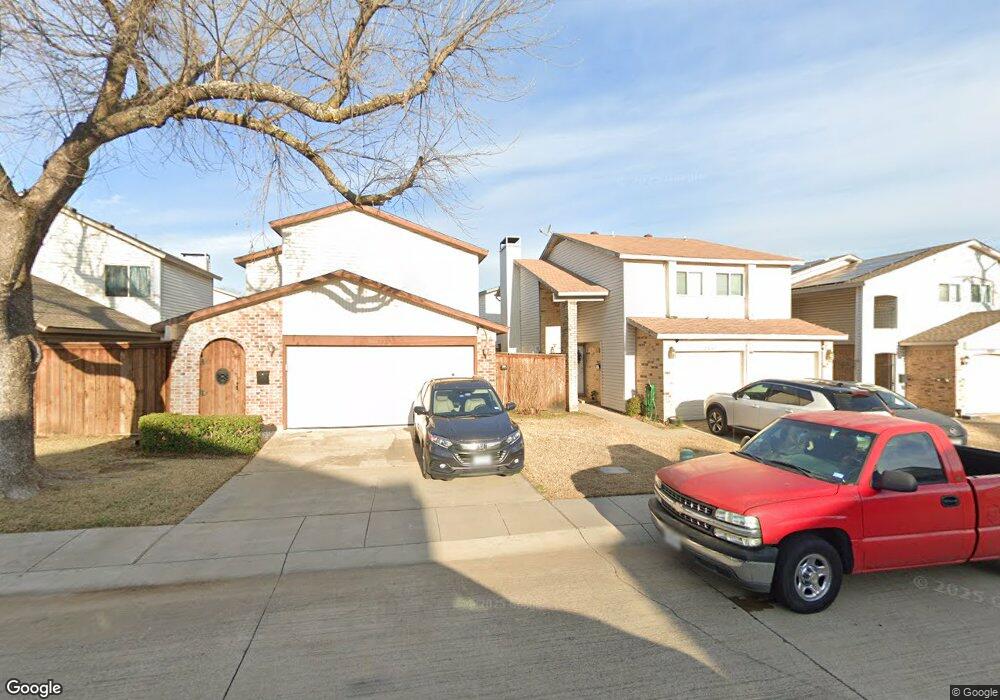
2006 Via Miramonte Carrollton, TX 75006
Southeast Carrollton NeighborhoodEstimated Value: $260,000 - $269,000
2
Beds
2
Baths
1,176
Sq Ft
$226/Sq Ft
Est. Value
About This Home
This home is located at 2006 Via Miramonte, Carrollton, TX 75006 and is currently estimated at $265,576, approximately $225 per square foot. 2006 Via Miramonte is a home located in Dallas County with nearby schools including Country Place Elementary School, Ted Polk Middle School, and Smith High School.
Ownership History
Date
Name
Owned For
Owner Type
Purchase Details
Closed on
Jul 8, 2013
Sold by
Ling Randall J
Bought by
Ling Randall J and Fletcher Jennifer
Current Estimated Value
Home Financials for this Owner
Home Financials are based on the most recent Mortgage that was taken out on this home.
Original Mortgage
$72,800
Outstanding Balance
$17,227
Interest Rate
3.94%
Mortgage Type
New Conventional
Estimated Equity
$248,349
Purchase Details
Closed on
Nov 1, 2006
Sold by
Rahn Rita Gail
Bought by
Ling Randall J
Home Financials for this Owner
Home Financials are based on the most recent Mortgage that was taken out on this home.
Original Mortgage
$76,000
Interest Rate
6.28%
Mortgage Type
Purchase Money Mortgage
Purchase Details
Closed on
Sep 30, 1996
Sold by
Mamdani Hul Ali and Mamdani Sabera
Bought by
Rahn Rita Gail
Home Financials for this Owner
Home Financials are based on the most recent Mortgage that was taken out on this home.
Original Mortgage
$65,945
Interest Rate
7.96%
Mortgage Type
FHA
Create a Home Valuation Report for This Property
The Home Valuation Report is an in-depth analysis detailing your home's value as well as a comparison with similar homes in the area
Home Values in the Area
Average Home Value in this Area
Purchase History
| Date | Buyer | Sale Price | Title Company |
|---|---|---|---|
| Ling Randall J | -- | Ctic | |
| Ling Randall J | -- | Ctic | |
| Rahn Rita Gail | -- | -- |
Source: Public Records
Mortgage History
| Date | Status | Borrower | Loan Amount |
|---|---|---|---|
| Open | Ling Randall J | $72,800 | |
| Closed | Ling Randall J | $76,000 | |
| Previous Owner | Rahn Rita Gail | $65,945 |
Source: Public Records
Tax History Compared to Growth
Tax History
| Year | Tax Paid | Tax Assessment Tax Assessment Total Assessment is a certain percentage of the fair market value that is determined by local assessors to be the total taxable value of land and additions on the property. | Land | Improvement |
|---|---|---|---|---|
| 2025 | $5,744 | $265,000 | $45,000 | $220,000 |
| 2024 | $5,744 | $279,440 | $45,000 | $234,440 |
| 2023 | $5,744 | $293,860 | $45,000 | $248,860 |
| 2022 | $5,776 | $252,780 | $45,000 | $207,780 |
| 2021 | $3,604 | $182,280 | $45,000 | $137,280 |
| 2020 | $4,232 | $170,520 | $45,000 | $125,520 |
| 2019 | $4,162 | $158,760 | $35,000 | $123,760 |
| 2018 | $3,877 | $147,000 | $28,000 | $119,000 |
| 2017 | $3,023 | $114,070 | $28,000 | $86,070 |
| 2016 | $2,805 | $105,840 | $18,000 | $87,840 |
| 2015 | $2,212 | $105,840 | $18,000 | $87,840 |
| 2014 | $2,212 | $94,080 | $14,000 | $80,080 |
Source: Public Records
Map
Nearby Homes
- 2107 Via Balboa
- 2001 Via Sevilla
- 2621 Via Cordova
- 2633 Via Cordova
- 2637 Via Cordova
- 2109 Via Del Plata
- 2518 Via Avenida
- 2518 Brooke Trail
- 2524 Rosebud Ct
- 2701 N Surrey Dr
- 2708 Heather Glen Ct
- 2622 Winterlake Dr
- 2709 Heather Glen Ct
- 2620 Carmel Dr
- 2505 Fountain Cove
- 2721 Fallcreek Dr
- 2711 N Surrey Dr
- 2709 Quail Ridge Dr
- 2706 Peach Tree Dr
- 2206 Meadowstone Dr
- 2004 Via Miramonte
- 2008 Via Miramonte
- 2010 Via Miramonte
- 2000 Via Miramonte
- 2007 Via Bravo
- 2002 Via Miramonte
- 2009 Via Bravo
- 2005 Via Bravo
- 2007 Via Miramonte
- 2011 Via Bravo
- 2003 Via Bravo
- 2009 Via Miramonte
- 2005 Via Miramonte
- 2012 Via Miramonte
- 2011 Via Miramonte
- 2003 Via Miramonte
- 2013 Via Bravo
- 2001 Via Bravo
- 2014 Via Miramonte
- 2013 Via Miramonte