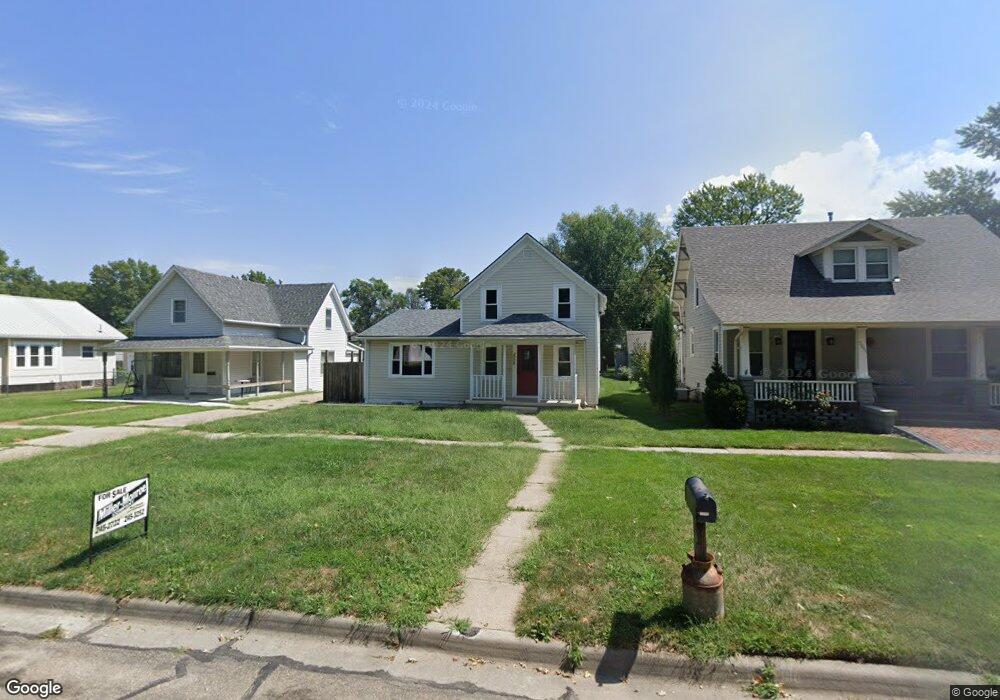
2006 Wilson St Falls City, NE 68355
Estimated Value: $86,000 - $104,000
3
Beds
1
Bath
1,653
Sq Ft
$58/Sq Ft
Est. Value
About This Home
This home is located at 2006 Wilson St, Falls City, NE 68355 and is currently estimated at $96,179, approximately $58 per square foot. 2006 Wilson St is a home located in Richardson County with nearby schools including Falls City North Elementary School, Falls City South Elementary School, and Falls City Middle School.
Ownership History
Date
Name
Owned For
Owner Type
Purchase Details
Closed on
Oct 9, 2024
Sold by
Hartley Jason Lee
Bought by
Taylor Clark
Current Estimated Value
Purchase Details
Closed on
Oct 2, 2015
Sold by
Richardson Cnty Bk & Trust Co
Bought by
Stamar Llc
Purchase Details
Closed on
Feb 8, 2013
Sold by
Landon Jeffrey S and Landon Kristene R
Bought by
Richardson County Bank And Trust Company
Purchase Details
Closed on
Aug 18, 2009
Sold by
Campbell Marvin R and Campbell Patricia A
Bought by
Landon Jeffrey S and Landon Kristene R
Purchase Details
Closed on
Mar 27, 2008
Sold by
Krause Eldora
Bought by
Campbell Marvin R and Campbell Patricia A
Create a Home Valuation Report for This Property
The Home Valuation Report is an in-depth analysis detailing your home's value as well as a comparison with similar homes in the area
Home Values in the Area
Average Home Value in this Area
Purchase History
| Date | Buyer | Sale Price | Title Company |
|---|---|---|---|
| Taylor Clark | $80,500 | -- | |
| Stamar Llc | $28,000 | -- | |
| Richardson County Bank And Trust Company | -- | -- | |
| Landon Jeffrey S | $43,500 | -- | |
| Campbell Marvin R | $8,700 | -- |
Source: Public Records
Tax History Compared to Growth
Tax History
| Year | Tax Paid | Tax Assessment Tax Assessment Total Assessment is a certain percentage of the fair market value that is determined by local assessors to be the total taxable value of land and additions on the property. | Land | Improvement |
|---|---|---|---|---|
| 2025 | $622 | $50,776 | $3,600 | $47,176 |
| 2024 | $622 | $48,385 | $3,600 | $44,785 |
| 2023 | $467 | $28,442 | $3,600 | $24,842 |
| 2022 | $486 | $25,295 | $1,620 | $23,675 |
| 2021 | $412 | $21,967 | $1,620 | $20,347 |
| 2020 | $398 | $20,998 | $1,620 | $19,378 |
| 2019 | $393 | $20,434 | $1,620 | $18,814 |
| 2018 | $386 | $19,886 | $1,620 | $18,266 |
| 2017 | $387 | $19,886 | $1,620 | $18,266 |
| 2016 | $375 | $19,354 | $1,620 | $17,734 |
| 2015 | $376 | $19,354 | $1,620 | $17,734 |
| 2014 | $376 | $19,354 | $1,620 | $17,734 |
Source: Public Records
Map
Nearby Homes