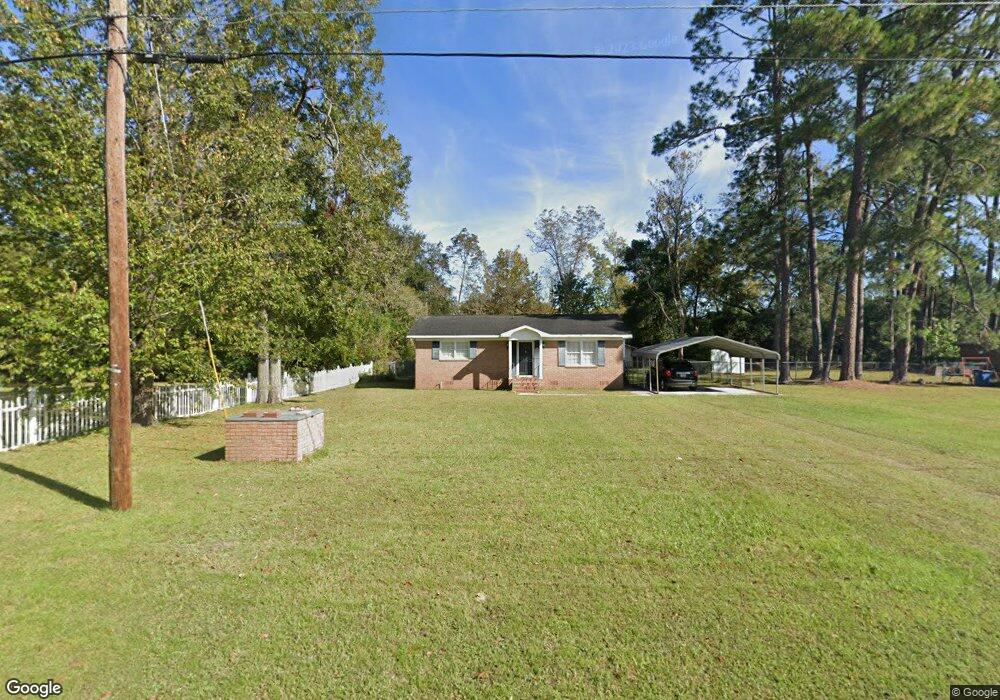
2006 Woodrow Ave Waycross, GA 31503
Estimated Value: $116,894 - $155,000
2
Beds
1
Bath
975
Sq Ft
$135/Sq Ft
Est. Value
About This Home
This home is located at 2006 Woodrow Ave, Waycross, GA 31503 and is currently estimated at $131,724, approximately $135 per square foot. 2006 Woodrow Ave is a home located in Ware County with nearby schools including Waresboro Elementary School, Ware County Middle School, and Ware County High School.
Ownership History
Date
Name
Owned For
Owner Type
Purchase Details
Closed on
Oct 7, 2021
Sold by
Morris Joseph P
Bought by
Wilson Matthew Ryan
Current Estimated Value
Home Financials for this Owner
Home Financials are based on the most recent Mortgage that was taken out on this home.
Original Mortgage
$94,140
Outstanding Balance
$85,847
Interest Rate
2.8%
Mortgage Type
New Conventional
Estimated Equity
$45,877
Purchase Details
Closed on
Feb 25, 2005
Sold by
Barber George M
Bought by
Morris Joseph P
Home Financials for this Owner
Home Financials are based on the most recent Mortgage that was taken out on this home.
Original Mortgage
$56,260
Interest Rate
5.6%
Mortgage Type
New Conventional
Purchase Details
Closed on
Oct 14, 1993
Bought by
Barber Geirge M and Barber Li
Purchase Details
Closed on
Feb 14, 1992
Bought by
Cribb S Phillip
Purchase Details
Closed on
Jan 31, 1992
Bought by
Dukes Donald E and Dukes Edn
Purchase Details
Closed on
Nov 8, 1986
Create a Home Valuation Report for This Property
The Home Valuation Report is an in-depth analysis detailing your home's value as well as a comparison with similar homes in the area
Home Values in the Area
Average Home Value in this Area
Purchase History
| Date | Buyer | Sale Price | Title Company |
|---|---|---|---|
| Wilson Matthew Ryan | $94,000 | -- | |
| Morris Joseph P | $58,000 | -- | |
| Barber Geirge M | $34,500 | -- | |
| Cribb S Phillip | $31,500 | -- | |
| Dukes Donald E | $28,500 | -- | |
| -- | -- | -- |
Source: Public Records
Mortgage History
| Date | Status | Borrower | Loan Amount |
|---|---|---|---|
| Open | Wilson Matthew Ryan | $94,140 | |
| Previous Owner | Morris Joseph P | $56,260 |
Source: Public Records
Tax History Compared to Growth
Tax History
| Year | Tax Paid | Tax Assessment Tax Assessment Total Assessment is a certain percentage of the fair market value that is determined by local assessors to be the total taxable value of land and additions on the property. | Land | Improvement |
|---|---|---|---|---|
| 2024 | $1,157 | $45,874 | $6,480 | $39,394 |
| 2023 | $1,181 | $25,332 | $2,376 | $22,956 |
| 2022 | $731 | $25,332 | $2,376 | $22,956 |
| 2021 | $490 | $20,194 | $2,376 | $17,818 |
| 2020 | $486 | $19,604 | $2,376 | $17,228 |
| 2019 | $486 | $18,873 | $2,376 | $16,497 |
| 2018 | $478 | $18,159 | $2,376 | $15,783 |
| 2017 | $478 | $18,159 | $2,376 | $15,783 |
| 2016 | $478 | $18,159 | $2,376 | $15,783 |
| 2015 | $483 | $18,159 | $2,376 | $15,783 |
| 2014 | $482 | $18,159 | $2,376 | $15,783 |
| 2013 | -- | $18,159 | $2,376 | $15,783 |
Source: Public Records
Map
Nearby Homes
- 2012 Woodrow Ave
- 1013 N Augusta Ave
- 2105 Woodrow Ave
- 2105 Hilliard Ave
- 1009 N Augusta Ave
- 2107 Hilliard Ave
- 1021 N Augusta Ave
- 1005 N Augusta Ave
- 1340 Lake St
- 1012 N Augusta Ave
- 1341 Lake St
- 2203 Hilliard Ave
- 1008 N Augusta Ave
- 1020 N Augusta Ave
- 2104 Hilliard Ave
- 2080 Hilliard Ave
- 1006 N Augusta Ave
- 2066 Lamar Ave
- 1001 N Augusta Ave
- 2140 Woodrow Ave