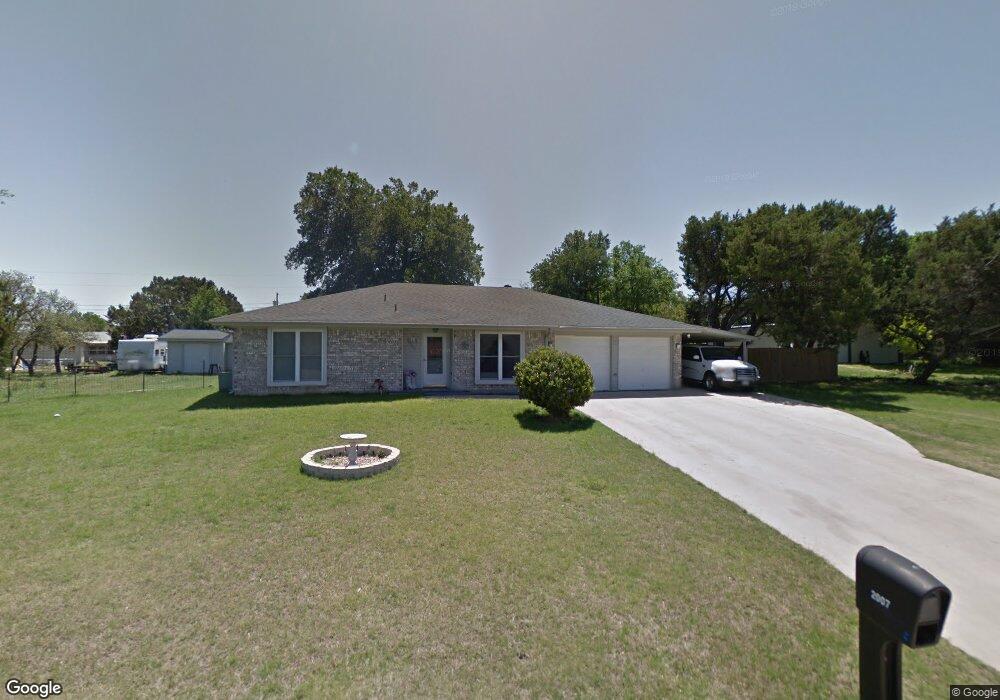
2007 Babb St Copperas Cove, TX 76522
Estimated Value: $185,787 - $224,000
3
Beds
1
Bath
1,551
Sq Ft
$132/Sq Ft
Est. Value
About This Home
This home is located at 2007 Babb St, Copperas Cove, TX 76522 and is currently estimated at $204,894, approximately $132 per square foot. 2007 Babb St is a home located in Coryell County with nearby schools including Fairview-Miss Jewell Elementary School, Copperas Cove Junior High School, and Copperas Cove High School.
Ownership History
Date
Name
Owned For
Owner Type
Purchase Details
Closed on
Mar 19, 2022
Sold by
Fontenot Doris Diane
Bought by
Fontenot Doris Diane and Fontenot Randall Dean
Current Estimated Value
Purchase Details
Closed on
Mar 18, 2022
Sold by
Price Revocable Trust
Bought by
Fontenot Doris Diane
Purchase Details
Closed on
Aug 12, 2014
Sold by
Fontenot Doris Diane
Bought by
Fontenot Doris Diane and The Price Revocable Trust
Home Financials for this Owner
Home Financials are based on the most recent Mortgage that was taken out on this home.
Original Mortgage
$82,200
Interest Rate
4.19%
Purchase Details
Closed on
Jun 7, 2006
Sold by
Kuntson Eugene C and Kuntson Donna M
Bought by
Price Doris D
Home Financials for this Owner
Home Financials are based on the most recent Mortgage that was taken out on this home.
Original Mortgage
$96,000
Interest Rate
6.58%
Create a Home Valuation Report for This Property
The Home Valuation Report is an in-depth analysis detailing your home's value as well as a comparison with similar homes in the area
Home Values in the Area
Average Home Value in this Area
Purchase History
| Date | Buyer | Sale Price | Title Company |
|---|---|---|---|
| Fontenot Doris Diane | -- | None Listed On Document | |
| Fontenot Doris Diane | -- | Cooley Baltrun Pllc | |
| Fontenot Doris Diane | -- | First American Title Ins Co | |
| Price Doris D | -- | -- |
Source: Public Records
Mortgage History
| Date | Status | Borrower | Loan Amount |
|---|---|---|---|
| Previous Owner | Fontenot Doris Diane | $82,200 | |
| Previous Owner | Price Doris D | $96,000 |
Source: Public Records
Tax History Compared to Growth
Tax History
| Year | Tax Paid | Tax Assessment Tax Assessment Total Assessment is a certain percentage of the fair market value that is determined by local assessors to be the total taxable value of land and additions on the property. | Land | Improvement |
|---|---|---|---|---|
| 2025 | -- | $181,959 | -- | -- |
| 2024 | -- | $165,417 | -- | -- |
| 2023 | $2,961 | $150,379 | $0 | $0 |
| 2022 | $3,067 | $174,220 | $25,000 | $149,220 |
| 2021 | $3,203 | $124,280 | $15,000 | $109,280 |
| 2020 | $3,005 | $114,764 | $15,000 | $99,764 |
| 2019 | $3,020 | $111,390 | $15,000 | $96,390 |
| 2018 | $2,854 | $105,190 | $15,000 | $90,190 |
| 2017 | $2,797 | $105,190 | $15,000 | $90,190 |
| 2016 | $2,857 | $107,440 | $15,000 | $92,440 |
| 2015 | $2,499 | $110,900 | $15,000 | $95,900 |
| 2014 | $2,499 | $104,060 | $15,000 | $89,060 |
Source: Public Records
Map
Nearby Homes
- 902 Tank St
- 1010 S 31st St
- TBD Live Oak Dr
- TBD Liveoak Cir
- 2806 Live Oak Dr
- 2607 Oak Hill Dr
- 2004 Veterans Ave
- 2705 Live Oak Dr
- 2109 Urbantke Ln
- 2002 Josie Cir
- 178 Grand Canyon Dr
- 182 Grand Canyon Dr
- 4881 County Rd Unit 104
- 1107 S 23rd St
- 1304 S 23rd St
- 2107 Brantley Ave
- 2110 Terrace Dr
- 901 S 23rd St
- 1002 Bleu Spur
- 1002 S 19th St
- 2009 Babb St
- 2308 Veterans Ave
- 2306 Veterans Ave
- 2010 Babb St
- 2012 Babb St
- 2304 Veterans Ave
- 2008 Babb St
- 2011 Babb St
- 2014 Babb St
- 2310 Veterans Ave
- 2312 Veterans Ave
- 2003 Babb St
- 2305 Veterans Ave
- 2016 Babb St
- 2302 Veterans Ave
- 2303 Veterans Ave
- 2314 Veterans Ave
- 2311 Veterans Ave
- 2301 Veterans Ave