Estimated Value: $149,000 - $159,000
3
Beds
2
Baths
1,647
Sq Ft
$94/Sq Ft
Est. Value
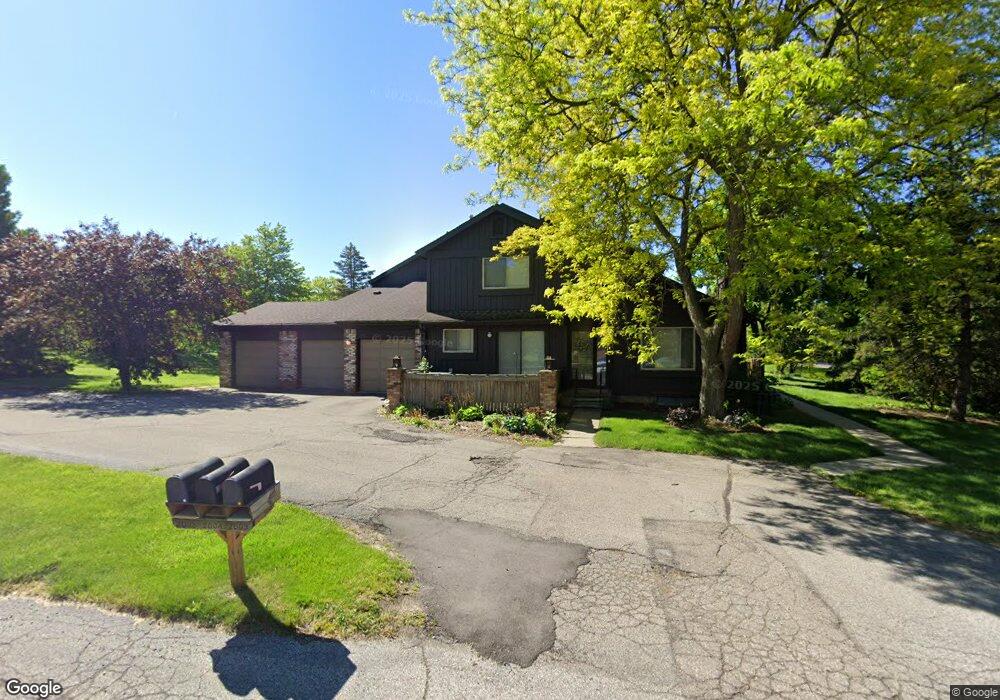
About This Home
This home is located at 2007 Beekman Ct Unit 130, Flint, MI 48532 and is currently estimated at $154,611, approximately $93 per square foot. 2007 Beekman Ct Unit 130 is a home located in Genesee County with nearby schools including Springview Elementary School, Flushing Middle School, and Flushing High School.
Ownership History
Date
Name
Owned For
Owner Type
Purchase Details
Closed on
Dec 30, 2020
Sold by
Lenoir Jeanette M
Bought by
Schafer Cheryl and Williams Pamela
Current Estimated Value
Purchase Details
Closed on
Mar 29, 2018
Sold by
Volpe Lia C and Volpe Robert
Bought by
Lenoir Jeanette M
Home Financials for this Owner
Home Financials are based on the most recent Mortgage that was taken out on this home.
Original Mortgage
$93,180
Interest Rate
4.75%
Mortgage Type
FHA
Purchase Details
Closed on
Sep 15, 2014
Sold by
Stetson Martha J
Bought by
Volpe Lia C and Volpe Robert
Create a Home Valuation Report for This Property
The Home Valuation Report is an in-depth analysis detailing your home's value as well as a comparison with similar homes in the area
Home Values in the Area
Average Home Value in this Area
Purchase History
| Date | Buyer | Sale Price | Title Company |
|---|---|---|---|
| Schafer Cheryl | $118,000 | None Available | |
| Lenoir Jeanette M | $94,900 | Liberty Title | |
| Volpe Lia C | $60,000 | Sargents Title Company |
Source: Public Records
Mortgage History
| Date | Status | Borrower | Loan Amount |
|---|---|---|---|
| Previous Owner | Lenoir Jeanette M | $93,180 |
Source: Public Records
Tax History Compared to Growth
Tax History
| Year | Tax Paid | Tax Assessment Tax Assessment Total Assessment is a certain percentage of the fair market value that is determined by local assessors to be the total taxable value of land and additions on the property. | Land | Improvement |
|---|---|---|---|---|
| 2025 | $2,165 | $65,000 | $0 | $0 |
| 2024 | $1,122 | $60,900 | $0 | $0 |
| 2023 | $1,071 | $53,700 | $0 | $0 |
| 2022 | $940 | $48,900 | $0 | $0 |
| 2021 | $1,919 | $45,400 | $0 | $0 |
| 2020 | $927 | $47,500 | $0 | $0 |
| 2019 | $918 | $40,600 | $0 | $0 |
| 2018 | $1,552 | $36,800 | $0 | $0 |
| 2017 | $1,443 | $36,800 | $0 | $0 |
| 2016 | $1,448 | $35,600 | $0 | $0 |
| 2015 | $1,320 | $35,600 | $0 | $0 |
| 2014 | $714 | $34,100 | $0 | $0 |
| 2012 | -- | $32,100 | $32,100 | $0 |
Source: Public Records
Map
Nearby Homes
- 2008 Beekman Ct
- 2091 Painted Post Dr Unit C10
- 5021 Forest Side Dr
- 2140 Painted Post Dr Unit 8
- 5104 Shady Oak Trail
- 2218 Disch St
- 1246 Dyemeadow Ln
- 5411 River Meadow Blvd
- 2372 Meadow St
- 5442 Meadow Creek Ct
- 2340 Pineview Ct
- 2371 Pineview Ct
- 2174 Mill Rd
- 6123 E River Rd
- 1090 Cabot Dr
- VL N Linden Rd
- 00 Emeraldwood Trail
- 74 Emeraldwood Trail
- 60 Emeraldwood Trail
- 1043 Balmoral Pkwy
- 2007 Beekman Ct Unit Bldg-Unit130
- 2007 Beekman Ct
- 2005 Beekman Ct
- 2003 Beekman Ct
- 2006 Beekman Ct Unit 128
- 2004 Beekman Ct
- 2009 Beekman Ct
- 2011 Beekman Ct
- 2013 Beekman Ct
- 2013 Beekman Ct Unit 134
- 2014 Beekman Ct Unit 135
- 2012 Beekman Ct
- 2018 Beekman Ct
- 2021 Beekman Ct
- 2026 Beekman Ct
- 2084 Walden Ct Unit 120
- 2084 Walden Ct
- 2082 Walden Ct
- 2015 Beekman Ct
- 2080 Walden Ct Unit 118