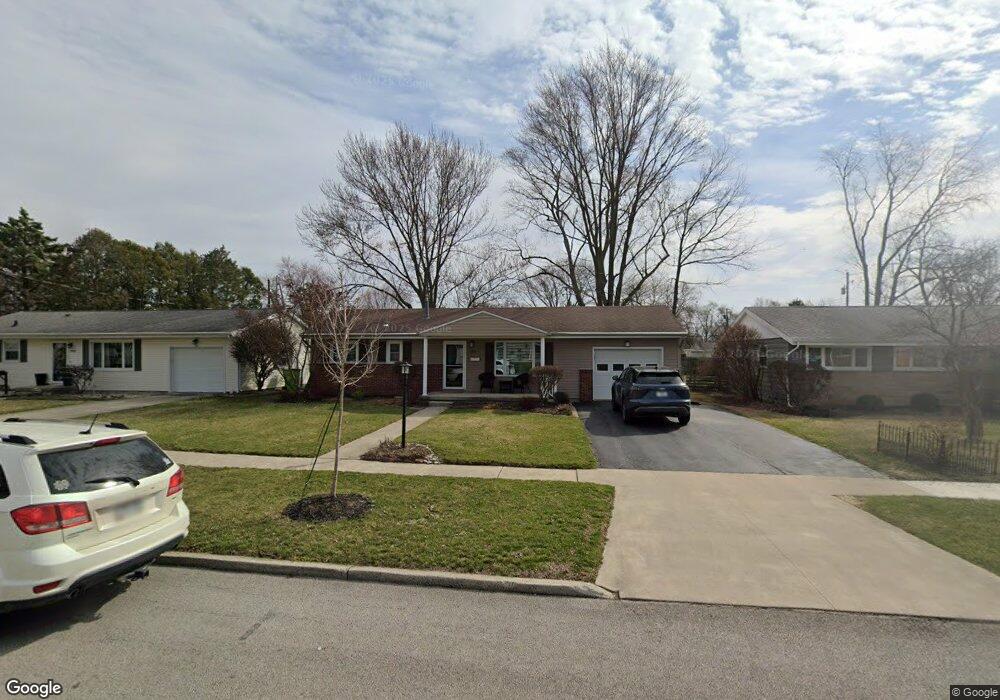
2007 Delmonte Dr Findlay, OH 45840
Estimated Value: $164,000 - $176,125
3
Beds
2
Baths
1,052
Sq Ft
$163/Sq Ft
Est. Value
About This Home
This home is located at 2007 Delmonte Dr, Findlay, OH 45840 and is currently estimated at $171,781, approximately $163 per square foot. 2007 Delmonte Dr is a home located in Hancock County with nearby schools including Northview Elementary School, Bigelow Hill Elementary School, and Glenwood Middle School.
Ownership History
Date
Name
Owned For
Owner Type
Purchase Details
Closed on
May 29, 2012
Sold by
Collins Margaret R
Bought by
Collins Margaret R
Current Estimated Value
Purchase Details
Closed on
Jul 2, 2001
Sold by
Neiling Dennis J
Bought by
Collins Margaret R
Home Financials for this Owner
Home Financials are based on the most recent Mortgage that was taken out on this home.
Original Mortgage
$93,100
Outstanding Balance
$34,306
Interest Rate
7.18%
Mortgage Type
New Conventional
Estimated Equity
$137,475
Purchase Details
Closed on
Jun 1, 1995
Sold by
Westfall Marcella
Bought by
Neiling Dennis
Home Financials for this Owner
Home Financials are based on the most recent Mortgage that was taken out on this home.
Original Mortgage
$71,250
Interest Rate
8.26%
Mortgage Type
New Conventional
Purchase Details
Closed on
Jul 7, 1992
Bought by
Westfall Marcella M
Purchase Details
Closed on
Oct 9, 1990
Bought by
Peeler James D
Create a Home Valuation Report for This Property
The Home Valuation Report is an in-depth analysis detailing your home's value as well as a comparison with similar homes in the area
Home Values in the Area
Average Home Value in this Area
Purchase History
| Date | Buyer | Sale Price | Title Company |
|---|---|---|---|
| Collins Margaret R | -- | Attorney | |
| Collins Margaret R | $98,000 | -- | |
| Neiling Dennis | $75,000 | -- | |
| Westfall Marcella M | $60,000 | -- | |
| Peeler James D | -- | -- |
Source: Public Records
Mortgage History
| Date | Status | Borrower | Loan Amount |
|---|---|---|---|
| Open | Collins Margaret R | $93,100 | |
| Previous Owner | Neiling Dennis | $71,250 |
Source: Public Records
Tax History
| Year | Tax Paid | Tax Assessment Tax Assessment Total Assessment is a certain percentage of the fair market value that is determined by local assessors to be the total taxable value of land and additions on the property. | Land | Improvement |
|---|---|---|---|---|
| 2024 | $1,644 | $45,320 | $6,830 | $38,490 |
| 2023 | $1,646 | $45,320 | $6,830 | $38,490 |
| 2022 | $1,648 | $45,320 | $6,830 | $38,490 |
| 2021 | $1,549 | $37,230 | $6,830 | $30,400 |
| 2020 | $1,549 | $37,230 | $6,830 | $30,400 |
| 2019 | $1,518 | $37,230 | $6,830 | $30,400 |
| 2018 | $1,294 | $29,780 | $5,460 | $24,320 |
| 2017 | $647 | $29,780 | $5,460 | $24,320 |
| 2016 | $1,284 | $29,780 | $5,460 | $24,320 |
| 2015 | $1,213 | $27,750 | $5,230 | $22,520 |
| 2014 | $1,214 | $27,750 | $5,230 | $22,520 |
| 2012 | $1,109 | $25,160 | $5,230 | $19,930 |
Source: Public Records
Map
Nearby Homes
- 528 Rector Ave
- 724 Edith Ave
- 701 W Melrose Ave
- 421 Clifton Ave
- 925 W Melrose Ave
- 315 W Melrose Ave
- 239 Edith Ave
- 232 Prentiss Ave
- 217 Prentiss Ave
- 400 Rosewood Ave
- 146 Clifton Ave
- 2419 Hollybrook Dr
- 705 Swing Ave
- 140 Monroe Ave
- 2605 Eton Place
- 2400 Hollybrook Dr
- 245 Edinborough Dr
- 120 W Melrose Ave
- 719 Davis St
- 605 Davis St
- 2001 Delmonte Dr
- 2015 Delmonte Dr
- 1943 Delmonte Dr
- 2006 Del Monte Dr
- 649 Edith Ave
- 1937 Delmonte Dr
- 637 Edith Ave
- 2006 Delmonte Dr
- 2000 Delmonte Dr
- 1944 Del Monte Dr
- 2012 Delmonte Dr
- 1944 Delmonte Dr
- 631 Edith Ave
- 701 Edith Ave
- 2006 Cottonwood St
- 2000 Cottonwood St
- 1938 Delmonte Dr
- 2012 Cottonwood St
- 1944 Cottonwood St
- 642 Ferndale Ave
Your Personal Tour Guide
Ask me questions while you tour the home.