Estimated Value: $388,000 - $426,000
4
Beds
2
Baths
1,952
Sq Ft
$210/Sq Ft
Est. Value
About This Home
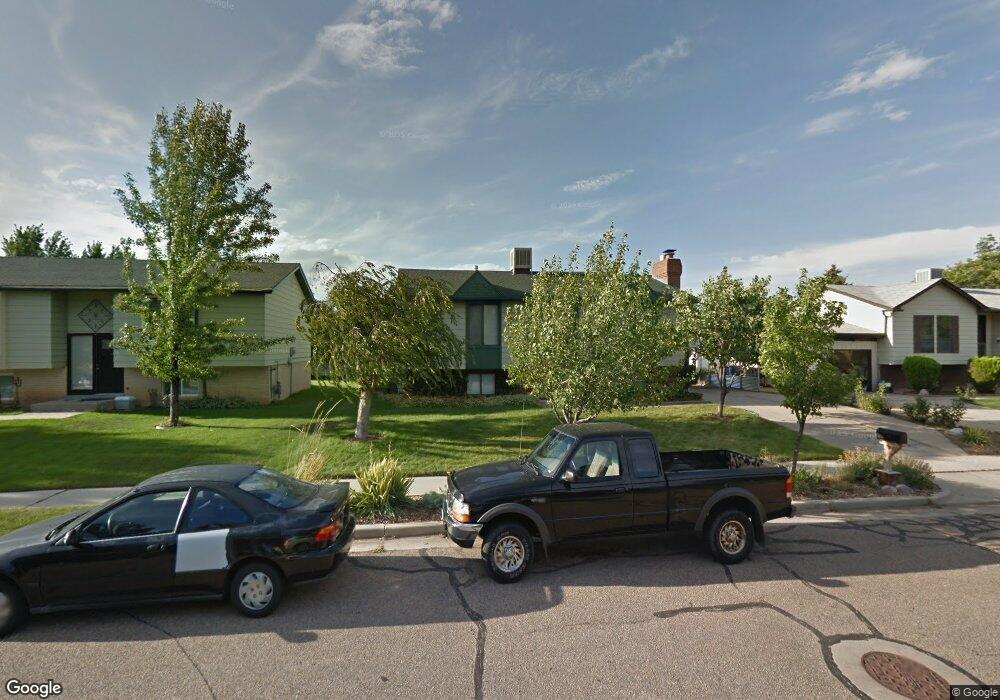
This home is located at 2007 E 5875 S, Ogden, UT 84403 and is currently estimated at $409,655, approximately $209 per square foot. 2007 E 5875 S is a home located in Weber County with nearby schools including Uintah School, South Ogden Junior High School, and Bonneville High School.
Ownership History
Date
Name
Owned For
Owner Type
Purchase Details
Closed on
Oct 11, 2023
Sold by
Sandoval Matthew Lee
Bought by
Willis Noah Dean and Ortiz Zackary Michael
Current Estimated Value
Home Financials for this Owner
Home Financials are based on the most recent Mortgage that was taken out on this home.
Original Mortgage
$366,244
Outstanding Balance
$357,782
Interest Rate
7.18%
Mortgage Type
Construction
Estimated Equity
$51,873
Purchase Details
Closed on
Oct 20, 2014
Sold by
Miller Preston J
Bought by
Sandoval Matthew Lee
Home Financials for this Owner
Home Financials are based on the most recent Mortgage that was taken out on this home.
Original Mortgage
$164,461
Interest Rate
4.08%
Mortgage Type
VA
Purchase Details
Closed on
Mar 29, 2000
Sold by
Bascom Darby and Bascom Julianne
Bought by
Miller Preston J
Home Financials for this Owner
Home Financials are based on the most recent Mortgage that was taken out on this home.
Original Mortgage
$114,363
Interest Rate
7.62%
Create a Home Valuation Report for This Property
The Home Valuation Report is an in-depth analysis detailing your home's value as well as a comparison with similar homes in the area
Home Values in the Area
Average Home Value in this Area
Purchase History
| Date | Buyer | Sale Price | Title Company |
|---|---|---|---|
| Willis Noah Dean | -- | Metro National Title | |
| Sandoval Matthew Lee | -- | Inwest Title | |
| Miller Preston J | -- | Equity Title |
Source: Public Records
Mortgage History
| Date | Status | Borrower | Loan Amount |
|---|---|---|---|
| Open | Willis Noah Dean | $366,244 | |
| Previous Owner | Sandoval Matthew Lee | $164,461 | |
| Previous Owner | Miller Preston J | $114,363 |
Source: Public Records
Tax History
| Year | Tax Paid | Tax Assessment Tax Assessment Total Assessment is a certain percentage of the fair market value that is determined by local assessors to be the total taxable value of land and additions on the property. | Land | Improvement |
|---|---|---|---|---|
| 2025 | $2,560 | $376,330 | $130,007 | $246,323 |
| 2024 | $2,443 | $202,399 | $71,503 | $130,896 |
| 2023 | $2,369 | $197,450 | $71,426 | $126,024 |
| 2022 | $2,135 | $181,500 | $63,254 | $118,246 |
| 2021 | $1,807 | $259,000 | $65,008 | $193,992 |
| 2020 | $1,761 | $237,000 | $49,960 | $187,040 |
| 2019 | $1,609 | $208,000 | $39,916 | $168,084 |
| 2018 | $1,425 | $175,000 | $39,916 | $135,084 |
| 2017 | $1,304 | $156,000 | $39,964 | $116,036 |
| 2016 | $1,166 | $78,593 | $18,519 | $60,074 |
| 2015 | $1,183 | $78,593 | $18,519 | $60,074 |
| 2014 | $940 | $61,164 | $18,519 | $42,645 |
Source: Public Records
Map
Nearby Homes
- 5685 S Village Cir
- 5973 S South Weber Dr
- 6362 S Ray Dr Unit 109
- 6361 S Ray Dr Unit 107
- 70 W Glen Way Unit 112
- 7870 S 2700 E
- 944 W Columbia Ct Unit 108
- 215 E 40th S
- 938 W Motor Vu Dr Unit 208
- 6387 S Ray Dr Unit 103
- 6374 S Ray Dr Unit 111
- 5199 S Paramount Cove
- 6368 S Ray Dr Unit 110
- 6371 S Ray Dr Unit 105
- 6379 S Ray Dr Unit 104
- 1879 E 5750 S
- 1847 E 5750 S
- 1805 E 5750 S
- 1810 E 5750 S
- 1894 E 5665 S
- 2015 E 5875 S
- 1987 E 5875 S
- 2008 E 5900 S
- 1988 E 5900 S
- 2029 E 5875 S
- 1973 E 5875 S
- 1998 E 5875 S
- 1984 E 5875 S
- 2028 E 5900 S
- 2026 E 5875 S
- 1997 E 5900 S
- 5880 Willow Wood Ln
- 2043 E 5875 S
- 5894 Willow Wood Ln
- 1972 E 5875 S
- 5895 Cedar Ln Unit 2050
- 1985 E 5900 S
- 2040 E 5875 S
- 1983 E 5850 S
- 5868 Willow Wood Ln