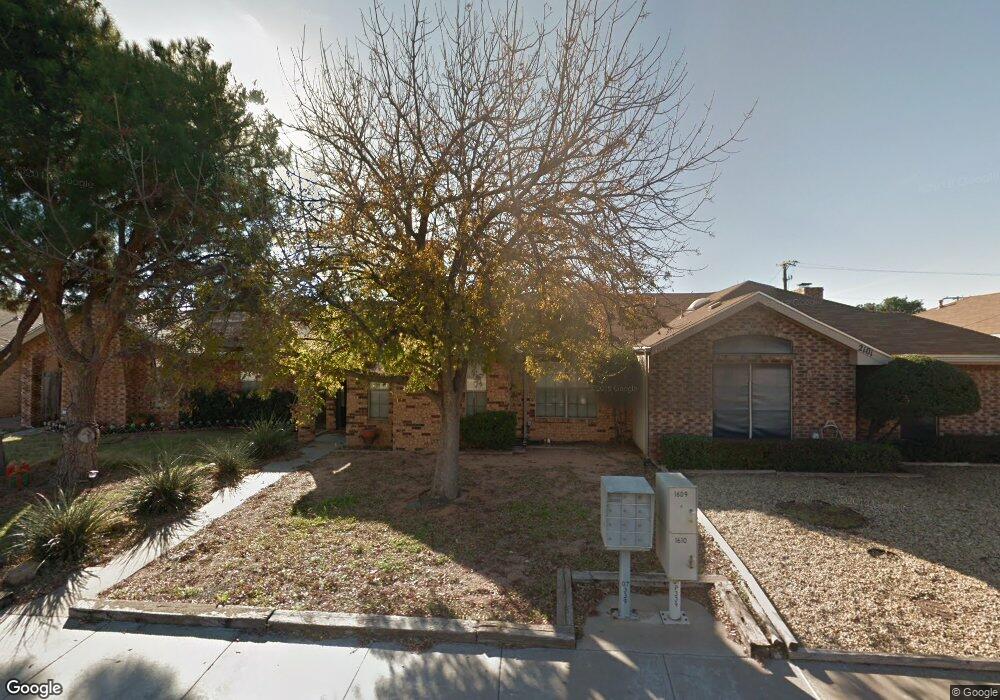
2007 Geraldine St Midland, TX 79707
Wedgewood Park NeighborhoodEstimated Value: $250,000 - $255,000
--
Bed
--
Bath
1,479
Sq Ft
$170/Sq Ft
Est. Value
About This Home
This home is located at 2007 Geraldine St, Midland, TX 79707 and is currently estimated at $252,001, approximately $170 per square foot. 2007 Geraldine St is a home located in Midland County with nearby schools including Rusk Elementary School, Alamo Junior High School, and Permian Basin Classical Academy.
Ownership History
Date
Name
Owned For
Owner Type
Purchase Details
Closed on
Sep 5, 2025
Sold by
Arbuckle Cynthia
Bought by
Davis Kay
Current Estimated Value
Purchase Details
Closed on
Mar 29, 2010
Sold by
Johnson Denise
Bought by
Arbuckle Cynthia
Home Financials for this Owner
Home Financials are based on the most recent Mortgage that was taken out on this home.
Original Mortgage
$108,000
Interest Rate
4.93%
Mortgage Type
New Conventional
Purchase Details
Closed on
Jan 15, 2009
Sold by
Foster Bruner Polly Leann
Bought by
Johnson Denise
Home Financials for this Owner
Home Financials are based on the most recent Mortgage that was taken out on this home.
Original Mortgage
$112,789
Interest Rate
5.48%
Mortgage Type
FHA
Purchase Details
Closed on
Nov 2, 1992
Bought by
Arbuckle Cynthia
Purchase Details
Closed on
Jan 1, 1901
Bought by
Arbuckle Cynthia
Create a Home Valuation Report for This Property
The Home Valuation Report is an in-depth analysis detailing your home's value as well as a comparison with similar homes in the area
Home Values in the Area
Average Home Value in this Area
Purchase History
| Date | Buyer | Sale Price | Title Company |
|---|---|---|---|
| Davis Kay | -- | None Listed On Document | |
| Arbuckle Cynthia | -- | None Available | |
| Johnson Denise | -- | Lone Star Abstract & Title C | |
| Arbuckle Cynthia | -- | -- | |
| Arbuckle Cynthia | -- | -- |
Source: Public Records
Mortgage History
| Date | Status | Borrower | Loan Amount |
|---|---|---|---|
| Previous Owner | Arbuckle Cynthia | $108,000 | |
| Previous Owner | Johnson Denise | $112,789 |
Source: Public Records
Tax History Compared to Growth
Tax History
| Year | Tax Paid | Tax Assessment Tax Assessment Total Assessment is a certain percentage of the fair market value that is determined by local assessors to be the total taxable value of land and additions on the property. | Land | Improvement |
|---|---|---|---|---|
| 2025 | $1,081 | $199,440 | $9,320 | $190,120 |
| 2024 | $1,085 | $202,070 | $9,320 | $192,750 |
| 2023 | $1,069 | $202,070 | $9,320 | $192,750 |
| 2022 | $3,102 | $198,530 | $9,320 | $189,210 |
| 2021 | $3,337 | $191,520 | $9,320 | $182,200 |
| 2020 | $1,897 | $187,440 | $9,320 | $178,120 |
| 2019 | $3,549 | $187,440 | $9,320 | $178,120 |
| 2018 | $3,407 | $175,250 | $9,320 | $165,930 |
| 2017 | $3,256 | $167,480 | $9,320 | $158,160 |
| 2016 | $3,022 | $163,160 | $9,320 | $153,840 |
| 2015 | -- | $158,590 | $9,320 | $149,270 |
| 2014 | -- | $154,750 | $9,320 | $145,430 |
Source: Public Records
Map
Nearby Homes
- 2000 Freeport Ln
- 1824 Northern Ln
- 1818 Northern Ln
- 4313 W Dengar Ave
- 4342 W Dengar Ave
- 3802 Suncrest Ave
- 2906 Aurora Ln
- 2306 Abbey Place
- 1509 Cascade Ct
- 3517 Seaboard Ave
- 3523 Lonoke Ave
- 1715 Bates St
- 1502 Alcove Ct
- 4618 Andrews Hwy
- 4310 Nelson Rd
- 4620 Andrews Hwy
- 3200 Highsky Dr
- 4206 Nelson Rd
- 0000 N Midland Dr
- 3210 Preston Dr
- 2101 Geraldine St
- 2005 Geraldine St
- 2103 Geraldine St
- 2003 Geraldine St
- 2105 Geraldine St
- 2001 Geraldine St
- 2006 Geraldine St
- 2004 Geraldine St
- 2100 Geraldine St
- 2102 Geraldine St
- 2002 Geraldine St
- 2104 Geraldine St
- 2000 Geraldine St
- 2201 Geraldine St
- 2106 Geraldine St
- 2108 Geraldine St
- 2203 Geraldine St
- 2007 Westwind Dr
- 2005 Westwind Dr
- 2205 Geraldine St