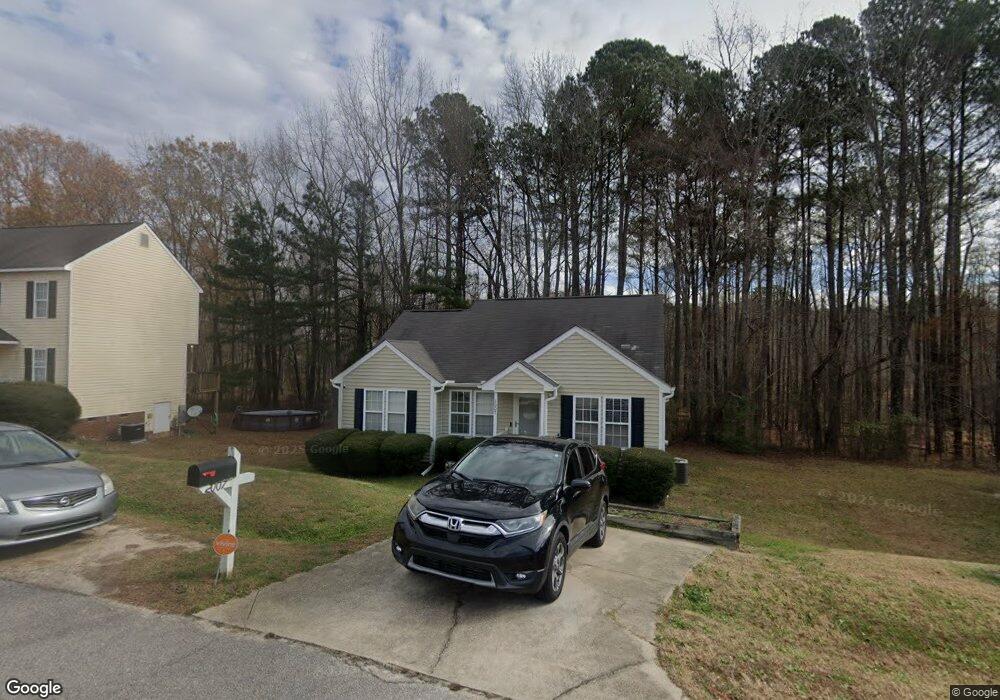
2007 Laurel Leaf Rd Zebulon, NC 27597
Estimated Value: $237,000 - $278,000
3
Beds
2
Baths
1,154
Sq Ft
$225/Sq Ft
Est. Value
About This Home
This home is located at 2007 Laurel Leaf Rd, Zebulon, NC 27597 and is currently estimated at $259,469, approximately $224 per square foot. 2007 Laurel Leaf Rd is a home located in Wake County with nearby schools including Wakelon Elementary School, Zebulon Magnet Middle School, and East Wake High School.
Ownership History
Date
Name
Owned For
Owner Type
Purchase Details
Closed on
Sep 13, 2017
Sold by
Eleazer Felix Q and Eleazer Vangela
Bought by
Holmes Jessica Christine
Current Estimated Value
Home Financials for this Owner
Home Financials are based on the most recent Mortgage that was taken out on this home.
Original Mortgage
$126,767
Outstanding Balance
$105,831
Interest Rate
3.89%
Mortgage Type
New Conventional
Estimated Equity
$153,638
Purchase Details
Closed on
Oct 30, 2003
Sold by
Phoenix Builders Inc
Bought by
Eleazer Felix Q
Home Financials for this Owner
Home Financials are based on the most recent Mortgage that was taken out on this home.
Original Mortgage
$91,774
Interest Rate
6.03%
Mortgage Type
FHA
Purchase Details
Closed on
Jan 7, 2003
Sold by
Skyline Development Corp
Bought by
Phoenix Builders Inc
Home Financials for this Owner
Home Financials are based on the most recent Mortgage that was taken out on this home.
Original Mortgage
$377,600
Interest Rate
6.1%
Create a Home Valuation Report for This Property
The Home Valuation Report is an in-depth analysis detailing your home's value as well as a comparison with similar homes in the area
Home Values in the Area
Average Home Value in this Area
Purchase History
| Date | Buyer | Sale Price | Title Company |
|---|---|---|---|
| Holmes Jessica Christine | $125,500 | None Available | |
| Eleazer Felix Q | $93,000 | -- | |
| Phoenix Builders Inc | $90,000 | -- |
Source: Public Records
Mortgage History
| Date | Status | Borrower | Loan Amount |
|---|---|---|---|
| Open | Holmes Jessica Christine | $126,767 | |
| Previous Owner | Eleazer Felix Q | $91,774 | |
| Previous Owner | Phoenix Builders Inc | $377,600 |
Source: Public Records
Tax History Compared to Growth
Tax History
| Year | Tax Paid | Tax Assessment Tax Assessment Total Assessment is a certain percentage of the fair market value that is determined by local assessors to be the total taxable value of land and additions on the property. | Land | Improvement |
|---|---|---|---|---|
| 2025 | $1,725 | $266,563 | $70,000 | $196,563 |
| 2024 | $1,675 | $266,563 | $70,000 | $196,563 |
Source: Public Records
Map
Nearby Homes
- 1247 Braemar Highland Dr
- 1202 Sumac Cir
- 413 Longleaf Glen Ln
- 513 Derby Place
- 613 Devon Place
- 501 Somerset Dr
- 301 Pony Rd
- 512 W Franklin St
- 813 N Church St
- 715 N Church St
- 15570 N Carolina 96
- 15600 N Carolina 96
- 732 Chandler Stone Dr
- 730 Chandler Stone Dr
- 728 Chandler Stone Dr
- 726 Chandler Stone Dr
- 722 Chandler Stone Dr
- 1240 Banjo Dr
- 718 Chandler Stone Dr
- 729 Chandler Stone Dr
- 2005 Laurel Leaf Rd
- 2009 Laurel Leaf Rd
- 2003 Laurel Leaf Rd
- 2011 Laurel Leaf Rd
- 2006 Laurel Leaf Rd
- 2008 Laurel Leaf Rd
- 1231 Wild Honeysuckle St
- 2001 Laurel Leaf Rd
- 2013 Laurel Leaf Rd
- 2010 Laurel Leaf Rd
- 1230 Wild Honeysuckle St
- 1233 Wild Honeysuckle St
- 2015 Laurel Leaf Rd
- 2012 Laurel Leaf Rd
- 2000 Laurel Leaf Rd
- 2000 Laurel Leaft Rd
- 2014 Laurel Leaf Rd
- 1235 Wild Honeysuckle St
- 2016 Laurel Leaf Rd
- 2017 Laurel Leaf Rd