2007 S Carl St Siloam Springs, AR 72761
Estimated Value: $243,000 - $326,000
4
Beds
2
Baths
1,769
Sq Ft
$160/Sq Ft
Est. Value
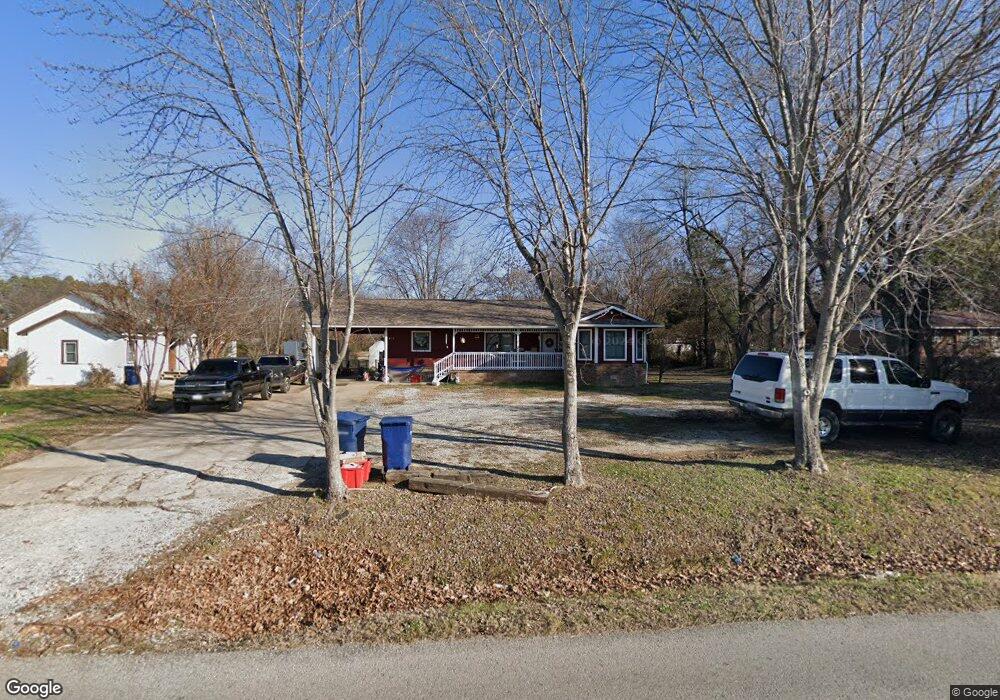
About This Home
This home is located at 2007 S Carl St, Siloam Springs, AR 72761 and is currently estimated at $282,171, approximately $159 per square foot. 2007 S Carl St is a home located in Benton County with nearby schools including Northside Elementary School, Southside Elementary School, and Delbert Pete & Pat Allen Elementary School.
Ownership History
Date
Name
Owned For
Owner Type
Purchase Details
Closed on
Jun 30, 2018
Sold by
Quintana Rafael and Quintana Angela
Bought by
Torre Martha De La and Torre Jose De La
Current Estimated Value
Home Financials for this Owner
Home Financials are based on the most recent Mortgage that was taken out on this home.
Original Mortgage
$136,000
Outstanding Balance
$117,881
Interest Rate
4.6%
Mortgage Type
New Conventional
Estimated Equity
$164,290
Purchase Details
Closed on
Jun 22, 2007
Sold by
Fletcher Douglas F and Fletcher Karen L
Bought by
Quintana Rafael
Home Financials for this Owner
Home Financials are based on the most recent Mortgage that was taken out on this home.
Original Mortgage
$131,400
Interest Rate
6.37%
Mortgage Type
Purchase Money Mortgage
Purchase Details
Closed on
Oct 1, 1993
Bought by
Fletcher
Purchase Details
Closed on
Aug 16, 1993
Bought by
Mcvay Trust
Purchase Details
Closed on
Sep 16, 1981
Bought by
Lavey
Create a Home Valuation Report for This Property
The Home Valuation Report is an in-depth analysis detailing your home's value as well as a comparison with similar homes in the area
Home Values in the Area
Average Home Value in this Area
Purchase History
| Date | Buyer | Sale Price | Title Company |
|---|---|---|---|
| Torre Martha De La | $170,000 | Waco Title Company | |
| Quintana Rafael | $146,000 | Waco Title Company | |
| Fletcher | $40,000 | -- | |
| Mcvay Trust | $30,000 | -- | |
| Lavey | $38,000 | -- |
Source: Public Records
Mortgage History
| Date | Status | Borrower | Loan Amount |
|---|---|---|---|
| Open | Torre Martha De La | $136,000 | |
| Previous Owner | Quintana Rafael | $131,400 |
Source: Public Records
Tax History Compared to Growth
Tax History
| Year | Tax Paid | Tax Assessment Tax Assessment Total Assessment is a certain percentage of the fair market value that is determined by local assessors to be the total taxable value of land and additions on the property. | Land | Improvement |
|---|---|---|---|---|
| 2025 | $2,126 | $52,858 | $12,432 | $40,426 |
| 2024 | $2,083 | $52,858 | $12,432 | $40,426 |
| 2023 | $1,984 | $38,540 | $10,040 | $28,500 |
| 2022 | $1,521 | $38,540 | $10,040 | $28,500 |
| 2021 | $1,431 | $38,540 | $10,040 | $28,500 |
| 2020 | $1,350 | $29,950 | $12,540 | $17,410 |
| 2019 | $1,350 | $29,950 | $12,540 | $17,410 |
| 2018 | $1,725 | $29,950 | $12,540 | $17,410 |
| 2017 | $1,725 | $29,950 | $12,540 | $17,410 |
| 2016 | $1,725 | $29,950 | $12,540 | $17,410 |
| 2015 | $1,596 | $27,700 | $10,300 | $17,400 |
| 2014 | $1,596 | $27,700 | $10,300 | $17,400 |
Source: Public Records
Map
Nearby Homes
- 820 W Deer Lodge Ct
- 419 W Hannibal St
- 1208 Jo Lynn St
- 0 S Carl St
- 412 W Kenwood St
- 0 S Mount Olive St
- 110 Cordes Dr
- 214 Lake Francis Dr
- 1702 Highway 412 W
- 920 W Granite St
- 620 S Elm St
- 817 S Katlyn Dr
- 2184/2214 S State Line Rd
- 2711 Summitt Dr
- 825 W Granite St
- 622 S Wright St
- 537 S Dogwood St
- 2503 Chanel St
- 1005 W Jefferson St
- Tract 2 Ok Hwy 59 & Hwy 412
- 2003 S Carl St
- 2001 S Carl St
- 2013 S Carl St
- 800 W Quarter Rd
- 1705 S Carl St
- 885 Deer Lodge Ct
- 863 Deer Lodge Ct
- 624 W Quarter Rd
- 624 W Quarter Rd
- 847 Deer Lodge Ct
- 1801 S Carl St
- 825 Deer Lodge Ct
- 804 W Quarter Rd
- 795 Deer Lodge Ct
- 777 Deer Lodge Ct
- 745 Deer Lodge Ct
- 898 Deer Lodge Ct
- 880 Deer Lodge Ct
- 860 Deer Lodge Ct
- 840 Deer Lodge Ct