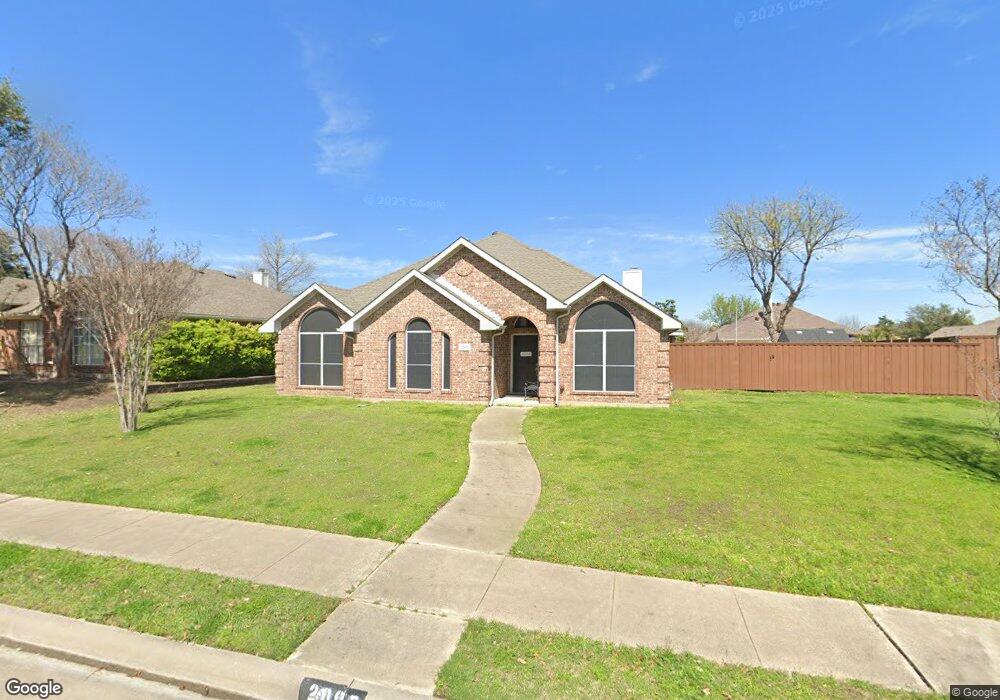
2007 Sandi Ln Sachse, TX 75048
Estimated Value: $365,750 - $387,000
3
Beds
2
Baths
1,775
Sq Ft
$211/Sq Ft
Est. Value
About This Home
This home is located at 2007 Sandi Ln, Sachse, TX 75048 and is currently estimated at $375,188, approximately $211 per square foot. 2007 Sandi Ln is a home located in Collin County with nearby schools including Don Whitt Elementary School, Dr. Al Draper Intermediate Middle School, and Raymond B Cooper J High School.
Ownership History
Date
Name
Owned For
Owner Type
Purchase Details
Closed on
Jul 19, 2001
Sold by
Chesser Janeen and Richison Janen
Bought by
Richison Mark Burt
Current Estimated Value
Purchase Details
Closed on
Sep 28, 2000
Sold by
Wilson Richard Bradley and Wilson Amy Carole
Bought by
Richison Mark and Richison Janeen
Home Financials for this Owner
Home Financials are based on the most recent Mortgage that was taken out on this home.
Original Mortgage
$132,408
Interest Rate
7.99%
Purchase Details
Closed on
Jul 31, 1995
Sold by
Holigan Family Investments Inc
Bought by
Wilson Richard Bradley and Wilson Amy Carole
Home Financials for this Owner
Home Financials are based on the most recent Mortgage that was taken out on this home.
Original Mortgage
$114,264
Interest Rate
7.49%
Create a Home Valuation Report for This Property
The Home Valuation Report is an in-depth analysis detailing your home's value as well as a comparison with similar homes in the area
Home Values in the Area
Average Home Value in this Area
Purchase History
| Date | Buyer | Sale Price | Title Company |
|---|---|---|---|
| Richison Mark Burt | -- | -- | |
| Richison Mark | -- | -- | |
| Wilson Richard Bradley | -- | -- |
Source: Public Records
Mortgage History
| Date | Status | Borrower | Loan Amount |
|---|---|---|---|
| Previous Owner | Richison Mark | $132,408 | |
| Previous Owner | Wilson Richard Bradley | $114,264 |
Source: Public Records
Tax History Compared to Growth
Tax History
| Year | Tax Paid | Tax Assessment Tax Assessment Total Assessment is a certain percentage of the fair market value that is determined by local assessors to be the total taxable value of land and additions on the property. | Land | Improvement |
|---|---|---|---|---|
| 2025 | $967 | $351,041 | $110,000 | $242,764 |
| 2024 | $967 | $319,128 | $110,000 | $271,916 |
| 2023 | $967 | $290,116 | $110,000 | $239,844 |
| 2022 | $6,019 | $263,742 | $90,000 | $227,252 |
| 2021 | $5,778 | $243,055 | $65,000 | $178,055 |
| 2020 | $5,481 | $217,968 | $65,000 | $152,968 |
| 2019 | $5,661 | $215,903 | $65,000 | $150,903 |
| 2018 | $5,464 | $205,466 | $65,000 | $140,466 |
| 2017 | $5,056 | $195,866 | $60,000 | $135,866 |
| 2016 | $4,644 | $182,614 | $50,000 | $132,614 |
| 2015 | $2,722 | $165,284 | $40,000 | $125,284 |
Source: Public Records
Map
Nearby Homes
- 7022 Cottonwood Cir
- 6905 Wilhelmina Dr
- 7010 Cottonwood Cir
- 2011 Cori Place
- 7307 Crane Dr
- 2006 Cori Place
- 2415 Green Meadow Dr
- 7319 Crane Dr
- 7117 Abilene Dr
- 403 Pleasant Run
- 6925 Dewitt Rd
- 2603 Grant Dr
- 2321 3rd St
- 179 Moonlight Dr
- 2605 Mcdearmon St
- 2004 Bonanza Dr
- 2911 Tracy Lynn Ln
- 3206 Creekside Dr
- 7612 Cindy Ln
- 6218 Dewitt St
- 2003 Sandi Ln
- 2011 Sandi Ln
- 2115 High Point Dr
- 2209 High Point Dr
- 2006 Sandi Ln
- 1919 Sandi Ln
- 2015 Sandi Ln
- 2111 High Point Dr
- 2213 High Point Dr
- 2002 Sandi Ln
- 7112 Wilhelmina Dr
- 2107 High Point Dr
- 2217 High Point Dr
- 1918 Sandi Ln
- 1915 Sandi Ln
- 2107 Sandi Ln
- 7108 Wilhelmina Dr
- 7121 Cottonwood Cir
- 2103 High Point Dr
- 2116 High Point Dr