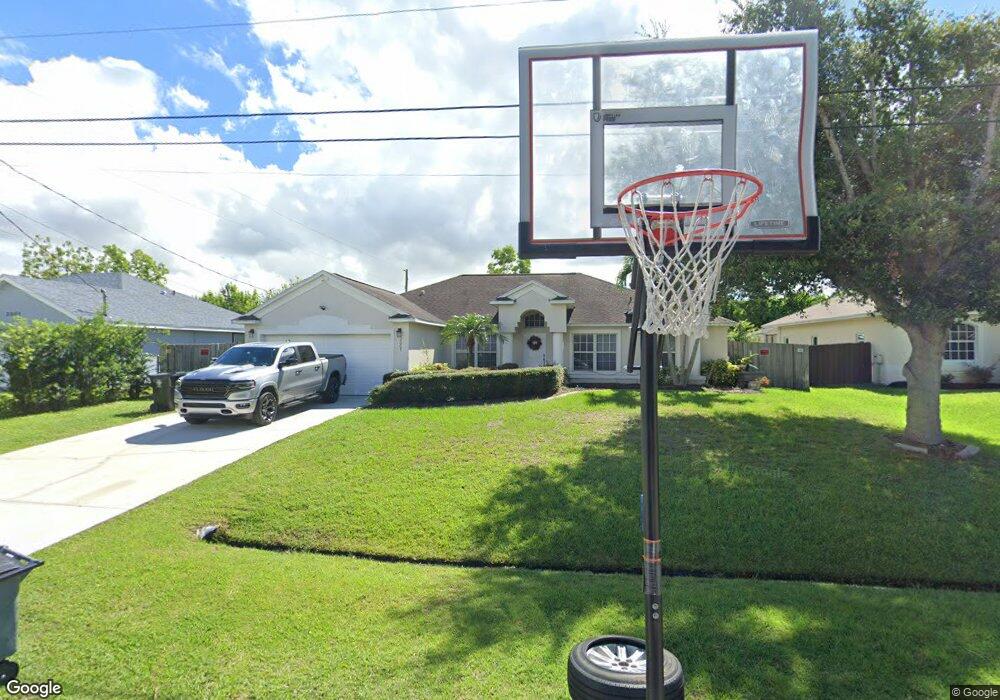
2007 SW Hampshire Ln Port Saint Lucie, FL 34953
Cashmere Cove NeighborhoodEstimated Value: $433,000 - $516,000
4
Beds
2
Baths
2,234
Sq Ft
$208/Sq Ft
Est. Value
About This Home
This home is located at 2007 SW Hampshire Ln, Port Saint Lucie, FL 34953 and is currently estimated at $464,180, approximately $207 per square foot. 2007 SW Hampshire Ln is a home located in St. Lucie County with nearby schools including Oak Hammock K-8 School, Bayshore Elementary School, and St. Lucie West Centennial High School.
Ownership History
Date
Name
Owned For
Owner Type
Purchase Details
Closed on
Jul 25, 2014
Sold by
Dresselhouse David and Dresselhouse Kulab
Bought by
Boonkham Anaporn
Current Estimated Value
Purchase Details
Closed on
Nov 23, 2009
Sold by
Markland Nadia M
Bought by
Dresselhouse David and Dresselhouse Kulab
Purchase Details
Closed on
Jul 28, 2005
Sold by
Beach Development Corp
Bought by
Markland Nadia M
Home Financials for this Owner
Home Financials are based on the most recent Mortgage that was taken out on this home.
Original Mortgage
$214,320
Interest Rate
5.51%
Mortgage Type
Fannie Mae Freddie Mac
Purchase Details
Closed on
May 19, 2004
Sold by
Quintero David and Quintero Carmen
Bought by
Mercedes Homes Inc
Purchase Details
Closed on
Jul 3, 2003
Sold by
Rodriguez Jorge
Bought by
Quintero David and Qintero Carmen Lo
Create a Home Valuation Report for This Property
The Home Valuation Report is an in-depth analysis detailing your home's value as well as a comparison with similar homes in the area
Home Values in the Area
Average Home Value in this Area
Purchase History
| Date | Buyer | Sale Price | Title Company |
|---|---|---|---|
| Boonkham Anaporn | $150,000 | Anchor Land Title Inc | |
| Dresselhouse David | $129,000 | Home Guardian Title Inc | |
| Markland Nadia M | $267,900 | -- | |
| Beach Development Corp | $220,500 | -- | |
| Mercedes Homes Inc | $39,000 | -- | |
| Quintero David | $14,000 | -- |
Source: Public Records
Mortgage History
| Date | Status | Borrower | Loan Amount |
|---|---|---|---|
| Previous Owner | Markland Nadia M | $214,320 |
Source: Public Records
Tax History Compared to Growth
Tax History
| Year | Tax Paid | Tax Assessment Tax Assessment Total Assessment is a certain percentage of the fair market value that is determined by local assessors to be the total taxable value of land and additions on the property. | Land | Improvement |
|---|---|---|---|---|
| 2024 | $3,602 | $179,770 | -- | -- |
| 2023 | $3,602 | $174,534 | $0 | $0 |
| 2022 | $3,457 | $169,451 | $0 | $0 |
| 2021 | $3,376 | $164,516 | $0 | $0 |
| 2020 | $3,395 | $162,245 | $0 | $0 |
| 2019 | $3,361 | $158,598 | $0 | $0 |
| 2018 | $3,195 | $155,641 | $0 | $0 |
| 2017 | $3,159 | $187,200 | $28,000 | $159,200 |
| 2016 | $3,114 | $193,700 | $24,800 | $168,900 |
| 2015 | $3,147 | $158,000 | $15,600 | $142,400 |
| 2014 | $2,506 | $127,586 | $0 | $0 |
Source: Public Records
Map
Nearby Homes
- 1901 SW Mcallister Ln
- 2049 SW Bayshore Blvd
- 1965 SW Bayshore Blvd
- 386 SW Donna Terrace
- 2108 SW Monterrey Ln
- 2086 SW Monterrey Ln
- 2080 SW Monterrey Ln
- 2109 SW Chestnut Ln
- 2091 SW Castinet Ln
- 362 SW de Gouvea Terrace
- 702 SW Arkansas Terrace
- 356 SW Grimaldo Terrace
- 2426 SW Monterrey Ln
- 1952 SW Cameo Blvd
- 2013 SW Burman Ln
- 2081 SW Bayshore Blvd
- 2033 SW Castinet Ln
- 333 SW Confidential Terrace
- 332 SW Grimaldo Terrace
- 1968 SW Monterrey Ln
- 2001 SW Hampshire Ln
- 2013 SW Hampshire Ln
- 1997 SW Hampshire Ln
- 2008 SW Hampshire Ln
- 2014 SW Hampshire Ln
- 2002 SW Hampshire Ln
- 1989 SW Hampshire Ln
- 2031 SW Hampshire Ln
- 2020 SW Hampshire Ln
- 1990 SW Hampshire Ln
- 2026 SW Hampshire Ln
- 2007 SW Mcallister Ln
- 2001 SW Mcallister Ln
- 2013 SW Mcallister Ln
- 1981 SW Hampshire Ln
- 2025 SW Hampshire Ln
- 2019 SW Mcallister Ln
- 1982 SW Hampshire Ln
- 2032 SW Hampshire Ln
- 1991 SW Mcallister Ln