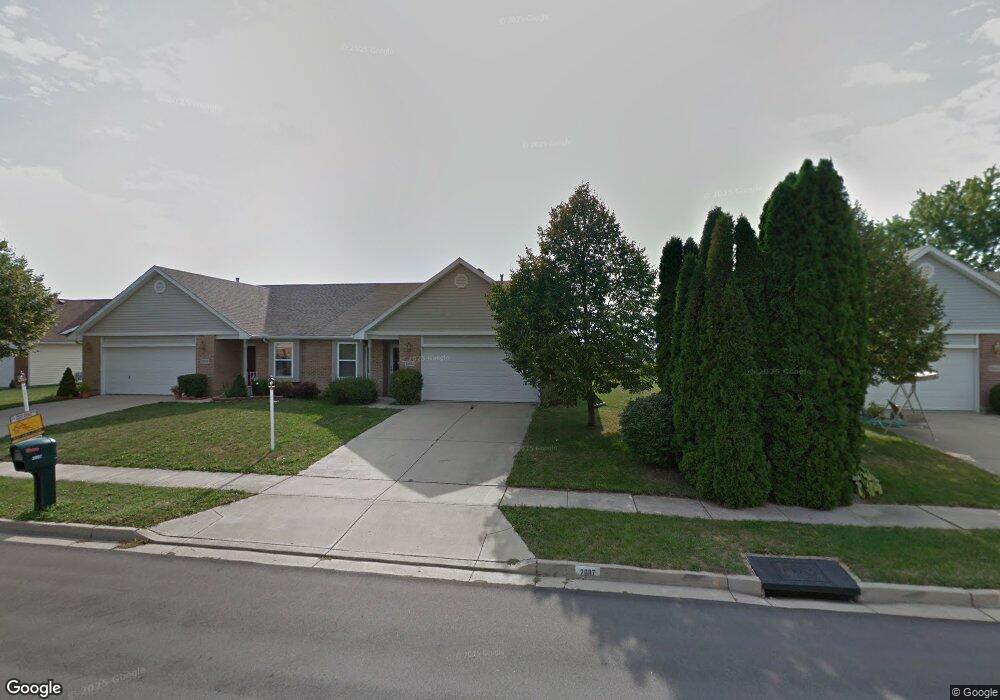
2007 Swallowtail Ct Clayton, OH 45315
Estimated Value: $172,000 - $188,003
2
Beds
2
Baths
1,146
Sq Ft
$156/Sq Ft
Est. Value
About This Home
This home is located at 2007 Swallowtail Ct, Clayton, OH 45315 and is currently estimated at $179,251, approximately $156 per square foot. 2007 Swallowtail Ct is a home located in Montgomery County with nearby schools including Englewood Hills Elementary School, Northmont High School, and Trotwood Preparatory & Fitness Academy.
Ownership History
Date
Name
Owned For
Owner Type
Purchase Details
Closed on
Jan 2, 2014
Sold by
Wells Fargo Bank Na
Bought by
Secretary Of Housing & Urban Development
Current Estimated Value
Purchase Details
Closed on
Dec 11, 2013
Sold by
Marr Carrie B
Bought by
Wells Fargo Bank Na
Purchase Details
Closed on
Oct 27, 2009
Sold by
Butschi Walter
Bought by
Marr Carrie B
Home Financials for this Owner
Home Financials are based on the most recent Mortgage that was taken out on this home.
Original Mortgage
$83,950
Interest Rate
5.07%
Mortgage Type
FHA
Purchase Details
Closed on
Jul 2, 2002
Sold by
Walter Butschi
Bought by
Butschi Walter and The Butschi Family Trust
Purchase Details
Closed on
Oct 3, 1997
Sold by
Vc 1 Partnership
Bought by
Butschi Walter
Create a Home Valuation Report for This Property
The Home Valuation Report is an in-depth analysis detailing your home's value as well as a comparison with similar homes in the area
Home Values in the Area
Average Home Value in this Area
Purchase History
| Date | Buyer | Sale Price | Title Company |
|---|---|---|---|
| Secretary Of Housing & Urban Development | -- | Attorney | |
| Wells Fargo Bank Na | $56,000 | None Available | |
| Marr Carrie B | $85,500 | Midwest Title Company | |
| Butschi Walter | -- | -- | |
| Butschi Walter | $100,000 | -- |
Source: Public Records
Mortgage History
| Date | Status | Borrower | Loan Amount |
|---|---|---|---|
| Previous Owner | Marr Carrie B | $83,950 |
Source: Public Records
Tax History
| Year | Tax Paid | Tax Assessment Tax Assessment Total Assessment is a certain percentage of the fair market value that is determined by local assessors to be the total taxable value of land and additions on the property. | Land | Improvement |
|---|---|---|---|---|
| 2025 | $2,175 | $46,600 | $12,430 | $34,170 |
| 2024 | $2,143 | $46,600 | $12,430 | $34,170 |
| 2023 | $2,143 | $46,600 | $12,430 | $34,170 |
| 2022 | $1,696 | $31,500 | $8,400 | $23,100 |
| 2021 | $1,701 | $31,500 | $8,400 | $23,100 |
| 2020 | $1,669 | $31,500 | $8,400 | $23,100 |
| 2019 | $1,853 | $31,420 | $9,660 | $21,760 |
| 2018 | $1,820 | $31,420 | $9,660 | $21,760 |
| 2017 | $1,808 | $31,420 | $9,660 | $21,760 |
| 2016 | $1,715 | $29,870 | $8,400 | $21,470 |
| 2015 | $2,249 | $29,870 | $8,400 | $21,470 |
| 2014 | $2,249 | $29,870 | $8,400 | $21,470 |
| 2012 | -- | $31,980 | $8,400 | $23,580 |
Source: Public Records
Map
Nearby Homes
- 1957 Swallowtail Ct
- 4952 Old Salem Rd
- 2030 Northcreek Dr
- 4329 Gorman Ave
- 918 Sunset Dr
- 4734 Rushwood Cir
- 4245 W Wenger Rd
- 7106 Cranlyn Dr
- 4614 W Wenger Rd
- 5071 Seville Dr
- 0 Hoke Rd Unit 942335
- 6042 Cinnamon Tree Ct
- 6901 Kinsey Rd
- 4220 Pleasanton Rd
- 6583 Benjamin Franklin Dr
- 505 Durst Dr
- 6047 Summersweet Dr
- 440 Katy Ln
- 6055 Layne Hills Ct
- 6269 Fall Gold Dr
- 2005 Swallowtail Ct
- 2009 Swallowtail Ct
- 2003 Swallowtail Ct
- 2011 Swallowtail Ct
- 2001 Swallowtail Ct
- 2013 Swallowtail Ct
- 2006 Swallowtail Ct
- 2008 Swallowtail Ct
- 2004 Swallowtail Ct
- 1999 Swallowtail Ct
- 2002 Swallowtail Ct
- 2010 Swallowtail Ct
- 604 Rubythroat Ln
- 2012 Swallowtail Ct
- 1997 Swallowtail Ct
- 2015 Swallowtail Ct
- 602 Rubythroat Ln
- 2017 Swallowtail Ct
- 1028 Meadow Thrush Dr
- 1026 Meadow Thrush Dr
Your Personal Tour Guide
Ask me questions while you tour the home.