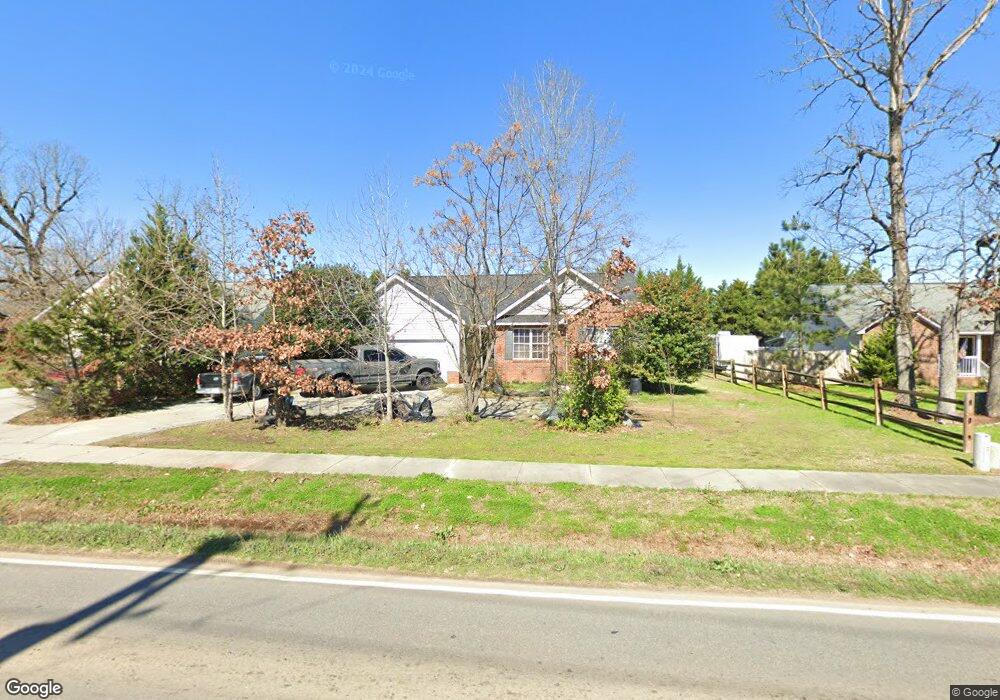
2007 Walkup Ave Monroe, NC 28110
Estimated Value: $269,000 - $288,920
3
Beds
2
Baths
1,393
Sq Ft
$199/Sq Ft
Est. Value
About This Home
This home is located at 2007 Walkup Ave, Monroe, NC 28110 and is currently estimated at $276,980, approximately $198 per square foot. 2007 Walkup Ave is a home located in Union County with nearby schools including Rock Rest Elementary School, Monroe Middle School, and Monroe High School.
Ownership History
Date
Name
Owned For
Owner Type
Purchase Details
Closed on
Nov 23, 2004
Sold by
Duncan James Richard and Duncan Allison P
Bought by
Juarez Ventura Francisco Carmen and Juarez Eusebio Vicenta
Current Estimated Value
Home Financials for this Owner
Home Financials are based on the most recent Mortgage that was taken out on this home.
Original Mortgage
$113,950
Outstanding Balance
$55,623
Interest Rate
5.66%
Mortgage Type
FHA
Estimated Equity
$221,357
Purchase Details
Closed on
Oct 23, 2002
Sold by
Bass Properties Of Union Llc
Bought by
Allen Wallace and Allen Bettie L
Purchase Details
Closed on
Jan 24, 2002
Sold by
Baucom Howard and Baucom Deborah
Bought by
Bass Properties Of Union Llc
Home Financials for this Owner
Home Financials are based on the most recent Mortgage that was taken out on this home.
Original Mortgage
$100,500
Interest Rate
7.08%
Purchase Details
Closed on
Nov 21, 2001
Sold by
Bowie Motors Of Monroe Inc
Bought by
Baucom Howard and Sandy Sidney M
Create a Home Valuation Report for This Property
The Home Valuation Report is an in-depth analysis detailing your home's value as well as a comparison with similar homes in the area
Purchase History
| Date | Buyer | Sale Price | Title Company |
|---|---|---|---|
| Juarez Ventura Francisco Carmen | $115,000 | Chicago Title Insurance Comp | |
| Allen Wallace | $23,000 | -- | |
| Bass Properties Of Union Llc | -- | -- | |
| Baucom Howard | $134,000 | -- |
Source: Public Records
Mortgage History
| Date | Status | Borrower | Loan Amount |
|---|---|---|---|
| Open | Juarez Ventura Francisco Carmen | $113,950 | |
| Previous Owner | Bass Properties Of Union Llc | $100,500 |
Source: Public Records
Tax History
| Year | Tax Paid | Tax Assessment Tax Assessment Total Assessment is a certain percentage of the fair market value that is determined by local assessors to be the total taxable value of land and additions on the property. | Land | Improvement |
|---|---|---|---|---|
| 2025 | $2,250 | $257,400 | $0 | $0 |
| 2024 | $1,578 | $144,700 | $29,000 | $115,700 |
| 2023 | $1,578 | $144,700 | $29,000 | $115,700 |
| 2022 | $1,578 | $144,700 | $29,000 | $115,700 |
| 2021 | $1,578 | $144,700 | $29,000 | $115,700 |
| 2020 | $1,599 | $118,650 | $12,250 | $106,400 |
| 2019 | $1,599 | $118,650 | $12,250 | $106,400 |
| 2018 | $732 | $118,650 | $12,250 | $106,400 |
| 2017 | $1,623 | $118,700 | $12,300 | $106,400 |
| 2016 | $1,606 | $118,650 | $12,250 | $106,400 |
| 2015 | $922 | $118,650 | $12,250 | $106,400 |
| 2014 | $1,546 | $126,750 | $24,820 | $101,930 |
Source: Public Records
Map
Nearby Homes
- 307 Jones St
- 706 Mcintyre St
- 707 Creekridge Dr
- 0 N Square Dr
- 948 Scotch Meadows Loop
- 1232 Scotch Meadows Loop
- 606 Lasalle St
- 720 Mclarty St
- 406 N Thompson St
- 913 Winchester Ave
- 500 Boyte St
- 1202 E Franklin St
- 417 Boyte St
- 1107 Burke St
- 802 E Franklin St
- 217 Winburn St
- 408 Willoughby Park Dr
- 416 Willoughby Park Dr
- 2789 Ashton Park Ln
- 1115 Unionville Indian Trail St Unit 1
- 2011 Walkup Ave
- 2003 Walkup Ave
- 1936 Bass Creek Ct Unit 17
- 1928 Bass Creek Ct
- 1942 Bass Creek Ct Unit 16
- 2015 Walkup Ave
- Lot 30 Bass Creek Ct
- Lot 22 Bass Creek Ct
- Lot 16 Bass Creek Ct
- 00 Bass Creek Ct Unit 30
- 00 Bass Creek Ct Unit 22
- 00 Bass Creek Ct Unit 16
- 1946 Bass Creek Ct
- 2019 Walkup Ave
- 2000 Bass Creek Ct
- 1939 Bass Creek Ct Unit 23
- 1939 Bass Creek Ct
- 1935 Bass Creek Ct Unit 22
- 1931 Bass Creek Ct
- 2023 Walkup Ave
Your Personal Tour Guide
Ask me questions while you tour the home.