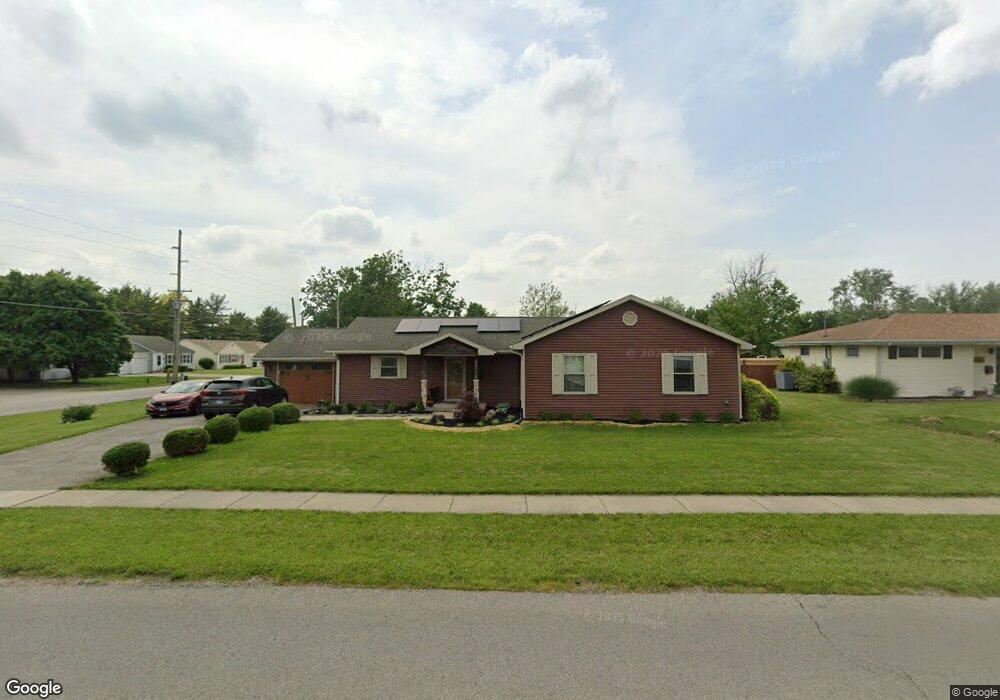
2008 20th St Charleston, IL 61920
Estimated Value: $203,804 - $227,000
3
Beds
2
Baths
1,836
Sq Ft
$116/Sq Ft
Est. Value
About This Home
This home is located at 2008 20th St, Charleston, IL 61920 and is currently estimated at $213,451, approximately $116 per square foot. 2008 20th St is a home located in Coles County with nearby schools including Charleston High School, Charleston Christian Academy, and Charleston Christian Academy High School.
Ownership History
Date
Name
Owned For
Owner Type
Purchase Details
Closed on
Jul 27, 2021
Sold by
Premier Prop Investment Holdings Llc
Bought by
Sims Keagan and Mckone Lauren
Current Estimated Value
Home Financials for this Owner
Home Financials are based on the most recent Mortgage that was taken out on this home.
Original Mortgage
$147,250
Outstanding Balance
$134,016
Interest Rate
2.96%
Mortgage Type
New Conventional
Estimated Equity
$79,435
Purchase Details
Closed on
Jan 26, 2018
Sold by
Strange Ryan A
Bought by
Premier Properties Investment Holdings L
Purchase Details
Closed on
Jul 8, 2010
Sold by
Sims Ernest E
Bought by
Strange Ryan A and Strange April T
Home Financials for this Owner
Home Financials are based on the most recent Mortgage that was taken out on this home.
Original Mortgage
$109,200
Interest Rate
4.74%
Mortgage Type
Construction
Purchase Details
Closed on
Aug 7, 2008
Sold by
Strange Ryan A and Strange April T
Bought by
Setzekorn Tamara
Create a Home Valuation Report for This Property
The Home Valuation Report is an in-depth analysis detailing your home's value as well as a comparison with similar homes in the area
Home Values in the Area
Average Home Value in this Area
Purchase History
| Date | Buyer | Sale Price | Title Company |
|---|---|---|---|
| Sims Keagan | $155,000 | Attorney | |
| Premier Properties Investment Holdings L | -- | -- | |
| Premier Properties Investment Holdings L | -- | -- | |
| Strange Ryan A | $45,000 | None Available | |
| Setzekorn Tamara | $78,500 | None Available |
Source: Public Records
Mortgage History
| Date | Status | Borrower | Loan Amount |
|---|---|---|---|
| Open | Sims Keagan | $147,250 | |
| Previous Owner | Strange Ryan A | $109,200 |
Source: Public Records
Tax History
| Year | Tax Paid | Tax Assessment Tax Assessment Total Assessment is a certain percentage of the fair market value that is determined by local assessors to be the total taxable value of land and additions on the property. | Land | Improvement |
|---|---|---|---|---|
| 2024 | $4,603 | $59,315 | $4,423 | $54,892 |
| 2023 | $4,542 | $54,169 | $4,039 | $50,130 |
| 2022 | $4,542 | $53,274 | $3,972 | $49,302 |
| 2021 | $4,679 | $51,127 | $3,812 | $47,315 |
| 2020 | $3,219 | $35,818 | $5,829 | $29,989 |
| 2019 | $3,167 | $34,570 | $5,626 | $28,944 |
| 2018 | $3,133 | $34,570 | $5,626 | $28,944 |
| 2017 | $3,092 | $34,570 | $5,626 | $28,944 |
| 2016 | $2,928 | $33,021 | $5,626 | $27,395 |
| 2015 | $1,985 | $33,021 | $5,626 | $27,395 |
| 2014 | $1,985 | $33,021 | $5,626 | $27,395 |
| 2013 | $1,985 | $33,021 | $5,626 | $27,395 |
Source: Public Records
Map
Nearby Homes
- 2007 Mckinley Ave
- 2004 Hayes Ave
- 2 Copperfield Ln
- 2614 Krishire Dr
- 2019 10th St
- 2015 & 2017 10th St
- 000 Buxton Wood Dr
- Lot 67 Hawthorne Dr
- Lot 65 Hawthorne Dr
- Lot 60 Hawthorne Dr
- Lot 52 Hawthorne Dr
- Lot 47 Hawthorne Dr
- Lot 43 Hawthorne Dr
- Lot 63 Hawthorne Dr
- Lot 59 Hawthorne Dr
- Lot 49 Hawthorne Dr
- Lot 45 Hawthorne Dr
- 405 Cedar Dr
- Lot 35 Tanglewood Dr
- Lot 28 Tanglewood Dr
- 1815 Mckinley Ave
- 2006 20th St
- 2007 20th St
- 2004 20th St
- 1816 Mckinley Ave
- 1813 Mckinley Ave
- 2005 20th St
- 2002 Mckinley Ave
- 2005 Mckinley Ave
- 1812 Mckinley Ave
- 1920 Cleveland Ave
- 1924 Cleveland Ave
- 2003 20th St
- 2108 Edgewood Dr
- 2004 Mckinley Ave
- 1811 Mckinley Ave
- 1916 Cleveland Ave
- 2107 Rosewood Ct
- 2101 Rosewood Ct
- 2107 Edgewood Dr
Your Personal Tour Guide
Ask me questions while you tour the home.