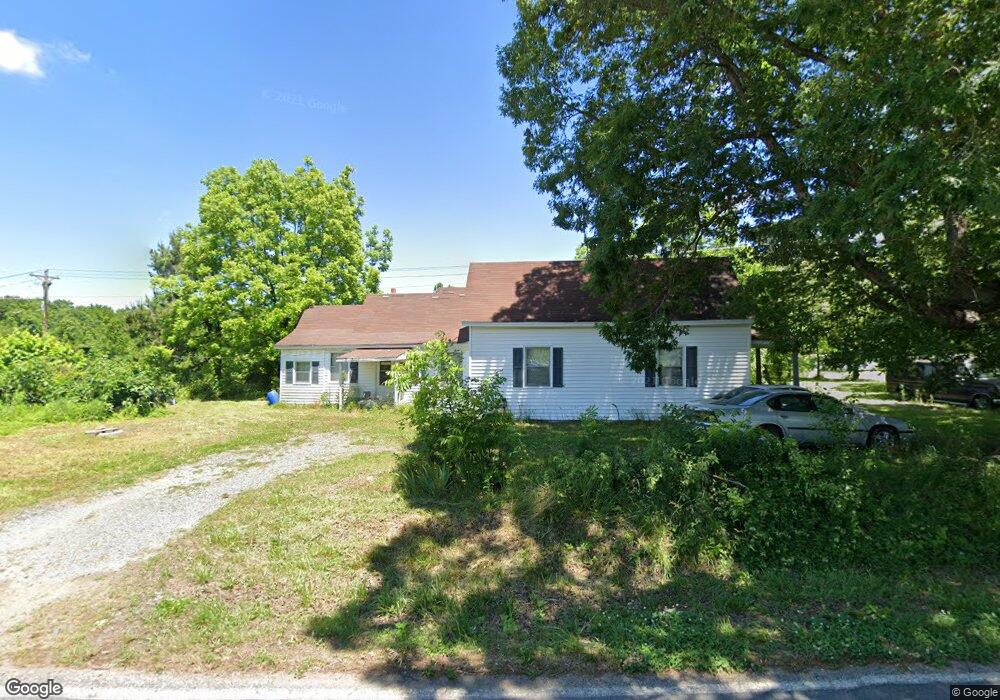
2008 Capernium Rd Cherryville, NC 28021
Estimated Value: $179,000 - $221,000
Studio
--
Bath
1,620
Sq Ft
$125/Sq Ft
Est. Value
About This Home
This home is located at 2008 Capernium Rd, Cherryville, NC 28021 and is currently estimated at $202,059, approximately $124 per square foot. 2008 Capernium Rd is a home located in Cleveland County with nearby schools including Washington Elementary School, Burns Middle, and Burns High School.
Ownership History
Date
Name
Owned For
Owner Type
Purchase Details
Closed on
Dec 20, 2024
Sold by
Oneal Addison Eric
Bought by
Addison Eric Oneal and Addison Sheba Shawan
Current Estimated Value
Home Financials for this Owner
Home Financials are based on the most recent Mortgage that was taken out on this home.
Original Mortgage
$144,991
Interest Rate
6.12%
Mortgage Type
New Conventional
Purchase Details
Closed on
Nov 6, 2024
Sold by
Witherspoon Angela Regina
Bought by
Witherspoon Shunda Ladonna
Home Financials for this Owner
Home Financials are based on the most recent Mortgage that was taken out on this home.
Original Mortgage
$144,991
Interest Rate
6.12%
Mortgage Type
New Conventional
Purchase Details
Closed on
Jun 3, 2022
Sold by
James Foster Willie
Bought by
Witherspoon Angela Regina
Purchase Details
Closed on
Aug 2, 2010
Sold by
Foster John E
Bought by
Foster Willie J and Wilson Clara F
Create a Home Valuation Report for This Property
The Home Valuation Report is an in-depth analysis detailing your home's value as well as a comparison with similar homes in the area
Home Values in the Area
Average Home Value in this Area
Purchase History
| Date | Buyer | Sale Price | Title Company |
|---|---|---|---|
| Addison Eric Oneal | -- | None Listed On Document | |
| Addison Eric Oneal | -- | None Listed On Document | |
| Witherspoon Shunda Ladonna | -- | None Listed On Document | |
| Witherspoon Shunda Ladonna | -- | None Listed On Document | |
| Witherspoon Angela Regina | $60,000 | None Listed On Document | |
| Foster Willie J | -- | None Available |
Source: Public Records
Mortgage History
| Date | Status | Borrower | Loan Amount |
|---|---|---|---|
| Previous Owner | Witherspoon Shunda Ladonna | $144,991 |
Source: Public Records
Tax History
| Year | Tax Paid | Tax Assessment Tax Assessment Total Assessment is a certain percentage of the fair market value that is determined by local assessors to be the total taxable value of land and additions on the property. | Land | Improvement |
|---|---|---|---|---|
| 2025 | $775 | $122,095 | $33,536 | $88,559 |
| 2024 | $416 | $49,151 | $28,137 | $21,014 |
| 2023 | $414 | $49,151 | $28,137 | $21,014 |
| 2022 | $469 | $49,151 | $28,137 | $21,014 |
| 2021 | $469 | $49,151 | $28,137 | $21,014 |
| 2020 | $556 | $58,320 | $39,152 | $19,168 |
| 2019 | $556 | $58,320 | $39,152 | $19,168 |
| 2018 | $552 | $58,320 | $39,152 | $19,168 |
| 2017 | $549 | $58,320 | $39,152 | $19,168 |
| 2016 | $523 | $58,320 | $39,152 | $19,168 |
| 2015 | $590 | $66,854 | $39,152 | $27,702 |
| 2014 | $590 | $66,854 | $39,152 | $27,702 |
Source: Public Records
Map
Nearby Homes
- N/A Briar Ln
- 00 Briar Ln
- 0000 Briar Ln
- 00 Thamon Rd
- 206 Fabian Dr Unit 50
- 106 Exeter Ln Unit 27
- 106 Fabian Dr Unit 17
- 2343 Cherryville Rd
- 113 Dakar Dr Unit 81
- 113 Dakar Dr Unit 81
- 114 Woodberry Dr
- 110 Linda Dr
- 140 Sador St
- 3+/-AC Milo Neal Rd Unit 4
- 4+/-AC Milo Neal Rd Unit LOT 5
- 3202 Marshall Wolfe Rd
- 3124 Harmon Homestead Rd
- 000 Harbor View Dr Unit 2
- 000 Harbor View Dr Unit 3
- 107 and 109 Sador St
- 2007 Capernium Rd
- 2007 Stony Point Rd
- 2003 Stony Point Rd
- 2017 Stony Point Rd
- 2009 Stony Point Rd
- 2003 Capernium Rd
- 2003 Capernium Rd
- 2020 Capernium Rd
- 2013 Stony Point Rd
- 2015 Capernium Rd
- 1929 Stony Point Rd
- 2008 Stony Point Rd
- 1928 Stony Point Rd
- 103 Ross Rd
- 2016 Stony Point Rd
- 1926 Stony Point Rd
- 205 Ross Rd
- 104 Jw Borders Dr
- 116 Ross Rd
- 2018 Stony Point Rd
Your Personal Tour Guide
Ask me questions while you tour the home.