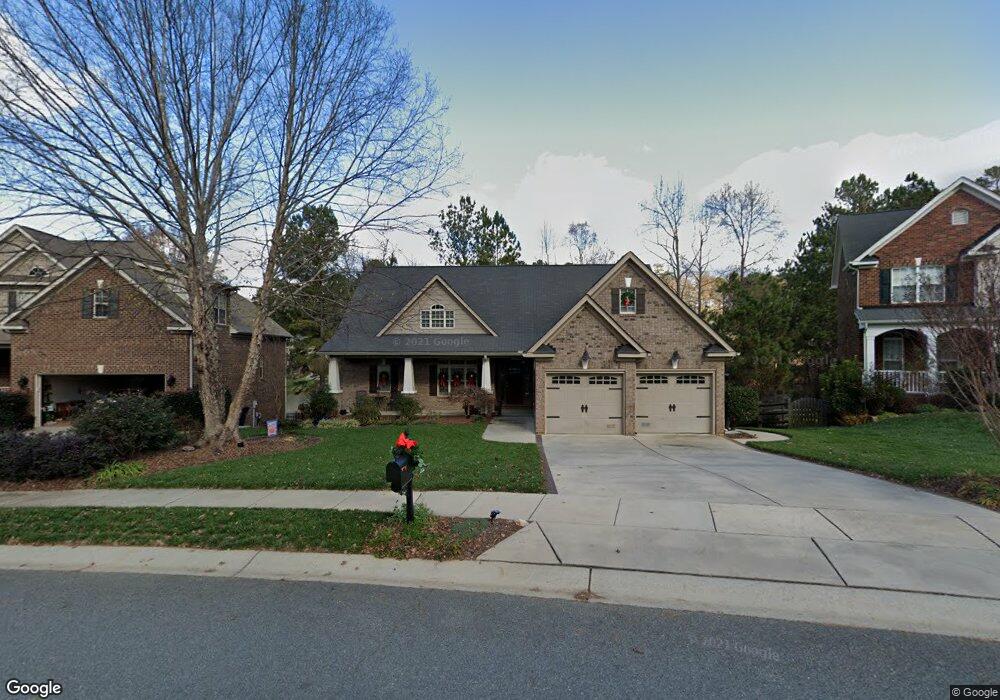
2008 Ivy Pond Ln Indian Trail, NC 28079
Estimated Value: $480,000 - $602,000
4
Beds
3
Baths
2,680
Sq Ft
$202/Sq Ft
Est. Value
About This Home
This home is located at 2008 Ivy Pond Ln, Indian Trail, NC 28079 and is currently estimated at $540,328, approximately $201 per square foot. 2008 Ivy Pond Ln is a home located in Union County with nearby schools including Indian Trail Elementary School, Sun Valley Middle School, and Sun Valley High School.
Ownership History
Date
Name
Owned For
Owner Type
Purchase Details
Closed on
Jun 19, 2013
Sold by
Forsloff Lee M
Bought by
Allison Thayer S and Allison Julie M
Current Estimated Value
Home Financials for this Owner
Home Financials are based on the most recent Mortgage that was taken out on this home.
Original Mortgage
$75,000
Outstanding Balance
$53,184
Interest Rate
3.42%
Mortgage Type
New Conventional
Estimated Equity
$487,144
Purchase Details
Closed on
Aug 25, 2006
Sold by
The Williams Co
Bought by
Forsloff Dennis E and Forsloff Lee M
Home Financials for this Owner
Home Financials are based on the most recent Mortgage that was taken out on this home.
Original Mortgage
$200,000
Interest Rate
6.67%
Mortgage Type
Unknown
Purchase Details
Closed on
Mar 6, 2006
Sold by
Fairview Developers Inc
Bought by
The Williams Co
Create a Home Valuation Report for This Property
The Home Valuation Report is an in-depth analysis detailing your home's value as well as a comparison with similar homes in the area
Home Values in the Area
Average Home Value in this Area
Purchase History
| Date | Buyer | Sale Price | Title Company |
|---|---|---|---|
| Allison Thayer S | $300,000 | None Available | |
| Forsloff Dennis E | $387,000 | Chicago Title Insurance Co | |
| The Williams Co | $160,000 | Chicago Title Insurance Co |
Source: Public Records
Mortgage History
| Date | Status | Borrower | Loan Amount |
|---|---|---|---|
| Open | Allison Thayer S | $75,000 | |
| Previous Owner | Forsloff Dennis E | $200,000 |
Source: Public Records
Tax History Compared to Growth
Tax History
| Year | Tax Paid | Tax Assessment Tax Assessment Total Assessment is a certain percentage of the fair market value that is determined by local assessors to be the total taxable value of land and additions on the property. | Land | Improvement |
|---|---|---|---|---|
| 2024 | $3,095 | $368,000 | $63,000 | $305,000 |
| 2023 | $3,074 | $368,000 | $63,000 | $305,000 |
| 2022 | $3,074 | $368,000 | $63,000 | $305,000 |
| 2021 | $3,071 | $368,000 | $63,000 | $305,000 |
| 2020 | $2,726 | $276,700 | $47,000 | $229,700 |
| 2019 | $2,726 | $276,700 | $47,000 | $229,700 |
| 2018 | $0 | $276,700 | $47,000 | $229,700 |
| 2017 | $2,865 | $276,700 | $47,000 | $229,700 |
| 2016 | $2,260 | $276,700 | $47,000 | $229,700 |
| 2015 | $2,289 | $276,700 | $47,000 | $229,700 |
| 2014 | $2,101 | $296,790 | $40,000 | $256,790 |
Source: Public Records
Map
Nearby Homes
- 4049 Fincher Rd Unit 3
- 1002 Raywood Ct
- 1068 Mapletree Ln
- 1072 Mapletree Ln
- 1081 Mapletree Ln
- 2016 Rosefield Ct
- 1065 Mapletree Ln
- 1053 Mapletree Ln
- 1045 Mapletree Ln
- 1056 Mapletree Ln
- 2012 Rosefield Ct
- 6012 Colton Ridge Dr
- 5717 Parkstone Dr
- 2929 Matoka Trail
- 4208 Blanchard Cir
- 225 Riverton Rd
- 5610 Golden Pond Dr
- 4315 Hartis Grove Church Rd
- 230 Quinn Rd
- 254 Quinn Rd
- 2006 Ivy Pond Ln
- 2010 Ivy Pond Ln
- 2010 Ivy Pond Ln Unit 26
- 2004 Ivy Pond Ln
- 2012 Ivy Pond Ln
- 2003 Ivy Pond Ln
- 2011 Ivy Pond Ln
- 2002 Ivy Pond Ln
- 1014 Brookhollow Ct
- 2014 Ivy Pond Ln
- 2005 Chandler Forest Ct
- 2002 Brookhollow Ct
- 1012 Brookhollow Ct
- 2015 Ivy Pond Ln
- 2003 Chandler Forest Ct
- 2004 Brookhollow Ct
- 2011 Chandler Forest Ct
- 1010 Brookhollow Ct
- 1008 Brookhollow Ct
- 2018 Ivy Pond Ln