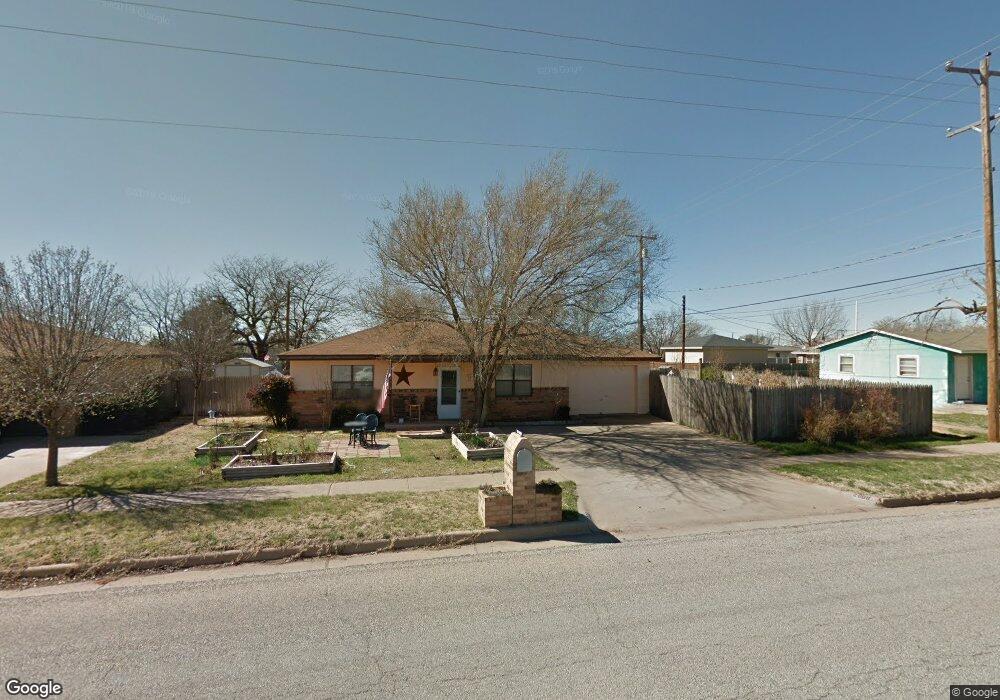
2008 Kewanee Ave Lubbock, TX 79407
West End NeighborhoodEstimated Value: $117,000 - $138,000
2
Beds
1
Bath
936
Sq Ft
$135/Sq Ft
Est. Value
About This Home
This home is located at 2008 Kewanee Ave, Lubbock, TX 79407 and is currently estimated at $125,964, approximately $134 per square foot. 2008 Kewanee Ave is a home located in Lubbock County with nearby schools including Westwind Elementary School, Heritage Middle School, and Frenship High School.
Ownership History
Date
Name
Owned For
Owner Type
Purchase Details
Closed on
Jun 21, 2011
Sold by
Marckley Tina Lea
Bought by
Martin Evelina C
Current Estimated Value
Home Financials for this Owner
Home Financials are based on the most recent Mortgage that was taken out on this home.
Original Mortgage
$40,000
Outstanding Balance
$11,898
Interest Rate
4.7%
Mortgage Type
Seller Take Back
Estimated Equity
$114,066
Purchase Details
Closed on
Sep 29, 1999
Sold by
Stanley Rowena
Bought by
Martin Evelina C
Purchase Details
Closed on
Jul 24, 1987
Sold by
Findley Ron
Bought by
Martin Evelina C
Create a Home Valuation Report for This Property
The Home Valuation Report is an in-depth analysis detailing your home's value as well as a comparison with similar homes in the area
Home Values in the Area
Average Home Value in this Area
Purchase History
| Date | Buyer | Sale Price | Title Company |
|---|---|---|---|
| Martin Evelina C | -- | None Available | |
| Martin Evelina C | -- | -- | |
| Martin Evelina C | -- | -- |
Source: Public Records
Mortgage History
| Date | Status | Borrower | Loan Amount |
|---|---|---|---|
| Open | Martin Evelina C | $40,000 |
Source: Public Records
Tax History Compared to Growth
Tax History
| Year | Tax Paid | Tax Assessment Tax Assessment Total Assessment is a certain percentage of the fair market value that is determined by local assessors to be the total taxable value of land and additions on the property. | Land | Improvement |
|---|---|---|---|---|
| 2025 | $304 | $81,511 | $3,760 | $77,751 |
| 2024 | $304 | $81,511 | $3,760 | $77,751 |
| 2023 | $1,586 | $75,725 | $3,760 | $71,965 |
| 2022 | $1,567 | $68,841 | $3,760 | $77,751 |
| 2021 | $1,513 | $62,583 | $3,760 | $68,246 |
| 2020 | $1,382 | $56,894 | $3,760 | $53,134 |
| 2019 | $1,422 | $56,894 | $3,760 | $53,134 |
| 2018 | $1,424 | $56,894 | $3,760 | $53,134 |
| 2017 | $1,347 | $53,759 | $3,760 | $49,999 |
| 2016 | $1,225 | $48,872 | $3,760 | $45,112 |
| 2015 | $576 | $44,429 | $3,760 | $40,669 |
| 2014 | $576 | $44,986 | $3,760 | $41,226 |
Source: Public Records
Map
Nearby Homes