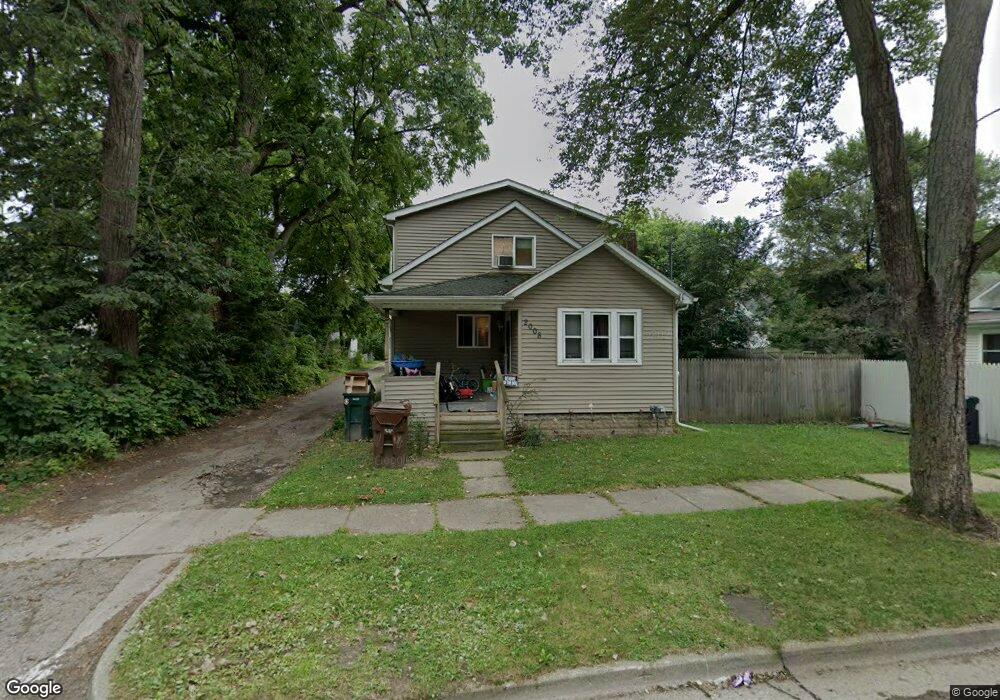
2008 Marcus St Lansing, MI 48912
Fairview Area NeighborhoodEstimated Value: $101,000 - $146,000
5
Beds
2
Baths
1,644
Sq Ft
$74/Sq Ft
Est. Value
About This Home
This home is located at 2008 Marcus St, Lansing, MI 48912 and is currently estimated at $122,218, approximately $74 per square foot. 2008 Marcus St is a home located in Ingham County with nearby schools including Pattengill Academy, Riddle Elementary School, and Eastern High School.
Ownership History
Date
Name
Owned For
Owner Type
Purchase Details
Closed on
Oct 29, 2007
Sold by
Williams Richard C
Bought by
Bryant Ramon and Bryant Mary
Current Estimated Value
Home Financials for this Owner
Home Financials are based on the most recent Mortgage that was taken out on this home.
Original Mortgage
$88,000
Outstanding Balance
$55,879
Interest Rate
6.45%
Mortgage Type
Purchase Money Mortgage
Estimated Equity
$66,339
Purchase Details
Closed on
Jun 22, 2004
Sold by
Prout Michael and Prout Carla
Bought by
Richard C Williams Living Trust
Purchase Details
Closed on
Jul 25, 2003
Sold by
Zellner Alvin
Bought by
Pelfery Bobbie and Pelfery Claudia
Purchase Details
Closed on
Nov 26, 1997
Sold by
Pelfery Bobbie and Pelfery Claudia
Bought by
Zellner Alvin
Home Financials for this Owner
Home Financials are based on the most recent Mortgage that was taken out on this home.
Original Mortgage
$406
Interest Rate
11%
Mortgage Type
Seller Take Back
Create a Home Valuation Report for This Property
The Home Valuation Report is an in-depth analysis detailing your home's value as well as a comparison with similar homes in the area
Home Values in the Area
Average Home Value in this Area
Purchase History
| Date | Buyer | Sale Price | Title Company |
|---|---|---|---|
| Bryant Ramon | $88,000 | Bell Title Company | |
| Richard C Williams Living Trust | $78,000 | Midstate Title Company | |
| Prout Michael | $20,000 | Midstate Title Company | |
| Pelfery Bobbie | -- | -- | |
| Zellner Alvin | $30,500 | -- | |
| Zellner Alvin | $29,500 | -- |
Source: Public Records
Mortgage History
| Date | Status | Borrower | Loan Amount |
|---|---|---|---|
| Open | Bryant Ramon | $88,000 | |
| Previous Owner | Zellner Alvin | $406 |
Source: Public Records
Tax History Compared to Growth
Tax History
| Year | Tax Paid | Tax Assessment Tax Assessment Total Assessment is a certain percentage of the fair market value that is determined by local assessors to be the total taxable value of land and additions on the property. | Land | Improvement |
|---|---|---|---|---|
| 2025 | $2,227 | $59,800 | $3,600 | $56,200 |
| 2024 | $17 | $52,100 | $3,600 | $48,500 |
| 2023 | $2,089 | $46,500 | $3,600 | $42,900 |
| 2022 | $1,886 | $39,500 | $2,900 | $36,600 |
| 2021 | $1,847 | $34,500 | $3,300 | $31,200 |
| 2020 | $1,835 | $32,200 | $3,300 | $28,900 |
| 2019 | $1,758 | $31,300 | $3,300 | $28,000 |
| 2018 | $1,649 | $28,800 | $3,300 | $25,500 |
| 2017 | $1,578 | $28,800 | $3,300 | $25,500 |
| 2016 | $1,510 | $28,300 | $3,300 | $25,000 |
| 2015 | $1,510 | $26,700 | $6,567 | $20,133 |
| 2014 | $1,510 | $26,300 | $6,567 | $19,733 |
Source: Public Records
Map
Nearby Homes
- 515 S Clemens Ave
- 528 S Fairview Ave
- 424 S Clemens Ave
- 637 S Clemens Ave
- 329 S Clemens Ave
- 412 S Hayford Ave
- 701 S Fairview Ave
- 624 S Hayford Ave
- 404 S Hayford Ave
- 607 Shepard St Unit 2
- 619 Shepard St
- 222 S Clemens Ave
- 727 S Magnolia Ave
- 426 S Francis Ave
- 2508 Marcus St
- 312 S Francis Ave
- 400 Lathrop St
- 207 Allen St
- 523 Clifford St
- 138 S Francis Ave
- 505 S Clemens Ave
- 509 S Clemens Ave
- 501 S Clemens Ave
- 511 S Clemens Ave
- 506 S Fairview Ave
- 504 S Fairview Ave
- 513 S Clemens Ave
- 510 S Fairview Ave
- 433 S Clemens Ave
- 500 S Fairview Ave
- 434 S Fairview Ave
- 514 S Fairview Ave
- 429 S Clemens Ave
- 517 S Clemens Ave
- 430 S Fairview Ave
- 518 S Fairview Ave
- 521 S Clemens Ave
- 425 S Clemens Ave
- 524 S Fairview Ave
- 500 S Clemens Ave