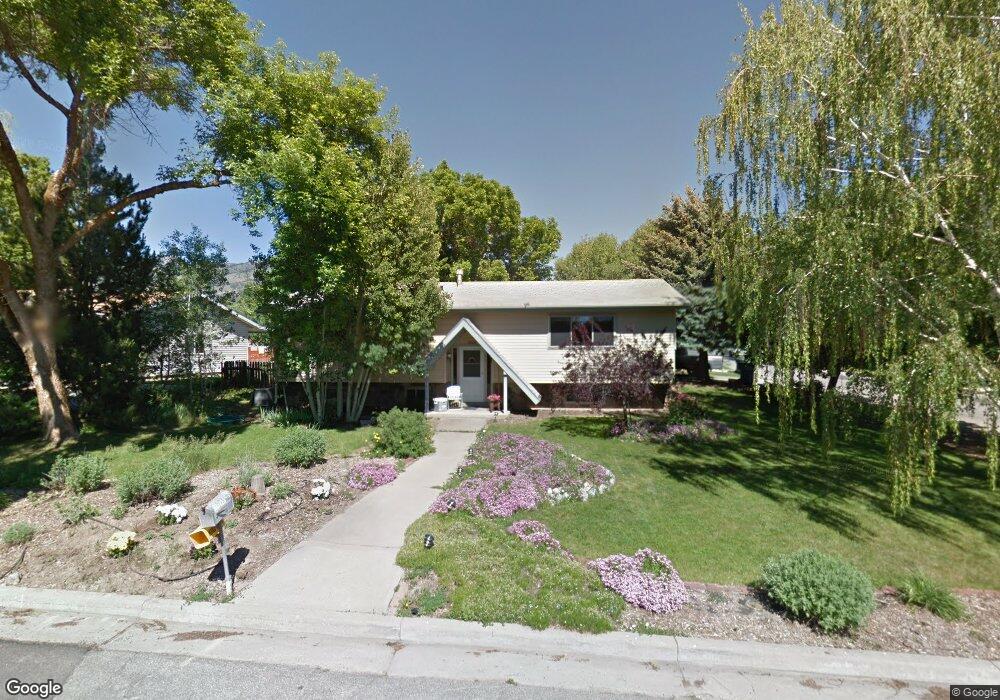
2008 N 1000 E North Logan, UT 84341
Estimated Value: $489,796 - $534,000
5
Beds
3
Baths
3,329
Sq Ft
$154/Sq Ft
Est. Value
About This Home
This home is located at 2008 N 1000 E, North Logan, UT 84341 and is currently estimated at $511,949, approximately $153 per square foot. 2008 N 1000 E is a home located in Cache County with nearby schools including Greenville School, Cedar Ridge School, and North Cache Middle School.
Ownership History
Date
Name
Owned For
Owner Type
Purchase Details
Closed on
Sep 2, 2021
Sold by
Kelly Tyson
Bought by
Kelly Tyson and Kelly Kilee S
Current Estimated Value
Home Financials for this Owner
Home Financials are based on the most recent Mortgage that was taken out on this home.
Original Mortgage
$308,000
Outstanding Balance
$277,976
Interest Rate
2.7%
Mortgage Type
New Conventional
Estimated Equity
$233,973
Purchase Details
Closed on
Jun 4, 2018
Sold by
Hawkes Joseph M and Hawkes Carm W
Bought by
Hawkes Joseph M and Hawkes Carma W
Purchase Details
Closed on
May 4, 2014
Sold by
Hawkes Joseph M and Hawkes Carma W
Bought by
The Hawkes Family Trust and Hawkes Carma W
Purchase Details
Closed on
Jun 25, 2007
Sold by
Hawkes Joseph M and Hawkes Carma W
Bought by
Hawkes Joseph M and Hawkes Carma W
Home Financials for this Owner
Home Financials are based on the most recent Mortgage that was taken out on this home.
Original Mortgage
$276,000
Interest Rate
5.98%
Mortgage Type
Reverse Mortgage Home Equity Conversion Mortgage
Create a Home Valuation Report for This Property
The Home Valuation Report is an in-depth analysis detailing your home's value as well as a comparison with similar homes in the area
Home Values in the Area
Average Home Value in this Area
Purchase History
| Date | Buyer | Sale Price | Title Company |
|---|---|---|---|
| Kelly Tyson | -- | Advanced Title | |
| Kelly Tyson | -- | Inwest Title | |
| Hawkes Joseph M | -- | None Available | |
| The Hawkes Family Trust | -- | None Available | |
| Hawkes Joseph M | -- | None Available |
Source: Public Records
Mortgage History
| Date | Status | Borrower | Loan Amount |
|---|---|---|---|
| Open | Kelly Tyson | $308,000 | |
| Previous Owner | Hawkes Joseph M | $276,000 |
Source: Public Records
Tax History
| Year | Tax Paid | Tax Assessment Tax Assessment Total Assessment is a certain percentage of the fair market value that is determined by local assessors to be the total taxable value of land and additions on the property. | Land | Improvement |
|---|---|---|---|---|
| 2025 | $2,086 | $291,970 | $0 | $0 |
| 2024 | $2,328 | $303,290 | $0 | $0 |
| 2023 | $2,393 | $291,740 | $0 | $0 |
| 2022 | $2,214 | $257,915 | $0 | $0 |
| 2021 | $207 | $374,220 | $58,500 | $315,720 |
| 2020 | $1,899 | $321,600 | $58,500 | $263,100 |
| 2019 | $1,445 | $233,612 | $58,500 | $175,112 |
| 2018 | $1,320 | $206,900 | $58,500 | $148,400 |
| 2017 | $1,240 | $102,300 | $0 | $0 |
| 2016 | $1,259 | $102,300 | $0 | $0 |
| 2015 | $1,264 | $102,300 | $0 | $0 |
| 2014 | $1,198 | $99,310 | $0 | $0 |
| 2013 | -- | $99,310 | $0 | $0 |
Source: Public Records
Map
Nearby Homes
- 1100 E 1900 N Unit 10
- 2143 N 950 E
- 1593 N 110 W Unit 201
- 611 E 2450 N Unit 1
- 1593 N 110 W Unit 202
- 1593 N 110 W Unit 204
- 1593 N 110 W Unit 203
- 1200 W 1400 N
- 2950 N Mahogony Valley Rd E Unit 7
- 1598 N Sharptail Cir
- 1000 W 2500 N
- 741 E 2200 N
- 673 E 2000 N
- 624 E 2100 N
- 2284 N 740 E
- 2025 N 1550 E
- 1495 E 2300 N
- Somerley Plan at Smiling H Ranch
- Viewside Plan at Smiling H Ranch
- Willow Plan at Smiling H Ranch
Your Personal Tour Guide
Ask me questions while you tour the home.