Estimated Value: $307,000 - $394,483
4
Beds
--
Bath
3,640
Sq Ft
$93/Sq Ft
Est. Value
About This Home
This home is located at 2008 N Leval Ratt Rd, Salem, IN 47167 and is currently estimated at $338,828, approximately $93 per square foot. 2008 N Leval Ratt Rd is a home located in Washington County with nearby schools including East Washington Elementary School, East Washington Middle School, and Eastern High School.
Ownership History
Date
Name
Owned For
Owner Type
Purchase Details
Closed on
Aug 24, 2023
Sold by
Girod Emanuel B and Girod Mandy F
Bought by
Girod Aden N and Girod Ida L
Current Estimated Value
Home Financials for this Owner
Home Financials are based on the most recent Mortgage that was taken out on this home.
Original Mortgage
$147,000
Outstanding Balance
$143,743
Interest Rate
6.96%
Mortgage Type
New Conventional
Estimated Equity
$195,085
Purchase Details
Closed on
Sep 13, 2021
Sold by
Girod Emanuel B and Girod Mandy F
Bought by
Girod Emanuel B and Girod Mandy F
Create a Home Valuation Report for This Property
The Home Valuation Report is an in-depth analysis detailing your home's value as well as a comparison with similar homes in the area
Home Values in the Area
Average Home Value in this Area
Purchase History
| Date | Buyer | Sale Price | Title Company |
|---|---|---|---|
| Girod Aden N | -- | None Listed On Document | |
| Girod Emanuel B | -- | None Available |
Source: Public Records
Mortgage History
| Date | Status | Borrower | Loan Amount |
|---|---|---|---|
| Open | Girod Aden N | $147,000 |
Source: Public Records
Tax History Compared to Growth
Tax History
| Year | Tax Paid | Tax Assessment Tax Assessment Total Assessment is a certain percentage of the fair market value that is determined by local assessors to be the total taxable value of land and additions on the property. | Land | Improvement |
|---|---|---|---|---|
| 2024 | $2,966 | $292,300 | $37,900 | $254,400 |
| 2023 | $2,809 | $276,600 | $34,900 | $241,700 |
| 2022 | $2,975 | $262,700 | $31,800 | $230,900 |
| 2021 | $2,327 | $205,800 | $31,800 | $174,000 |
| 2020 | $2,178 | $198,600 | $31,700 | $166,900 |
| 2019 | $1,724 | $165,300 | $34,300 | $131,000 |
| 2018 | $1,668 | $160,400 | $34,800 | $125,600 |
| 2017 | $1,506 | $166,500 | $36,900 | $129,600 |
| 2016 | $1,266 | $152,300 | $37,900 | $114,400 |
| 2014 | $1,271 | $158,200 | $38,800 | $119,400 |
| 2013 | $1,101 | $144,800 | $36,400 | $108,400 |
Source: Public Records
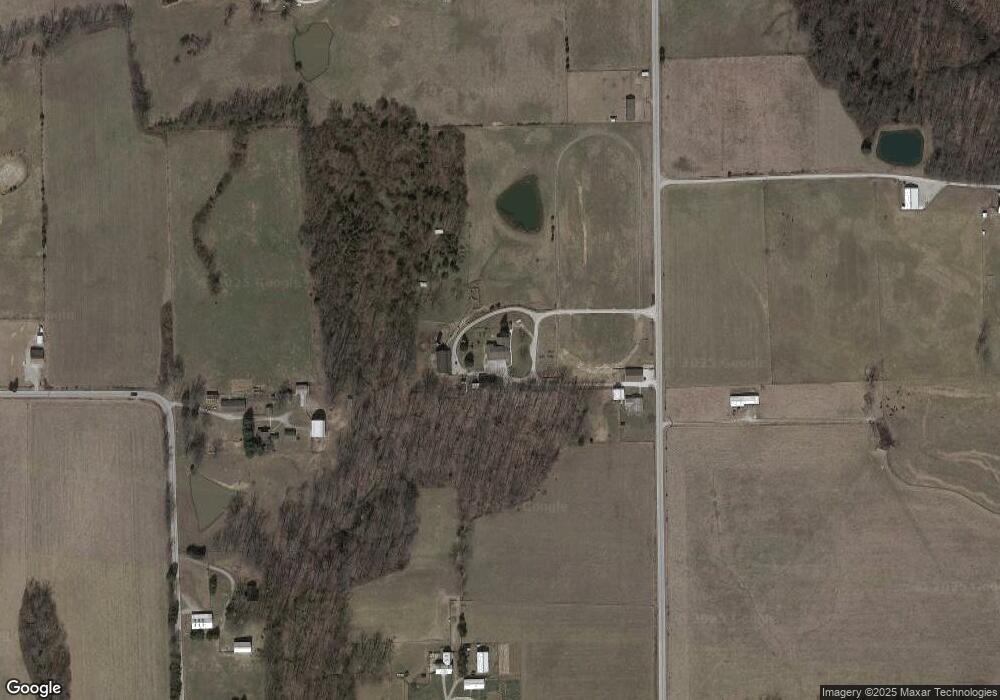
Map
Nearby Homes
- 2 N Leval Ratt Rd
- 8091 E New Philadelphia Rd
- 0 North St Unit LotWP002 16975283
- 6430 E Old 56
- E E Old 56 Unit 4
- 2476 N Old 56
- 0 E Old State Road 56
- 9781 E New Philadelphia Rd
- 3403 Lino Ln
- 4313 E Canton Rd
- 10832 E Old State Road 56
- 11213 E Old State Road 56
- 3305 E Randy Ln
- 2506 S Mount Zion Church Rd
- 2698 S Mount Zion Church Rd
- 2535 E Nathans Run
- 11015 Indiana 160
- 130 E Eastern Hills Blvd
- 7000 S State Road 39
- 4885 E Farabee Rd
- 2008 N Leval Ratt Rd
- 1911 N Naugle Rd
- 1824 N Leval Ratt Rd
- 1857 N Naugle Rd
- 2192 N Leval Ratt Rd
- 2221 N Leval Ratt Rd
- 2087 N Leval Ratt Rd
- 1745 N Leval Ratt Rd
- 1971 N Naugle Rd
- 2338 N Leval Ratt Rd
- 1564 N Leval Ratt Rd
- 1762 N Naugle Rd
- 2448 N Leval Ratt Rd
- 2296 N Naugle Rd
- 2034 N Naugle Rd
- 1599 N Ewen Rd
- 2194 N Naugle Rd
- 1561 N Leval Ratt Rd
- 2412 N Naugle Rd
- 1770 N Naugle Rd