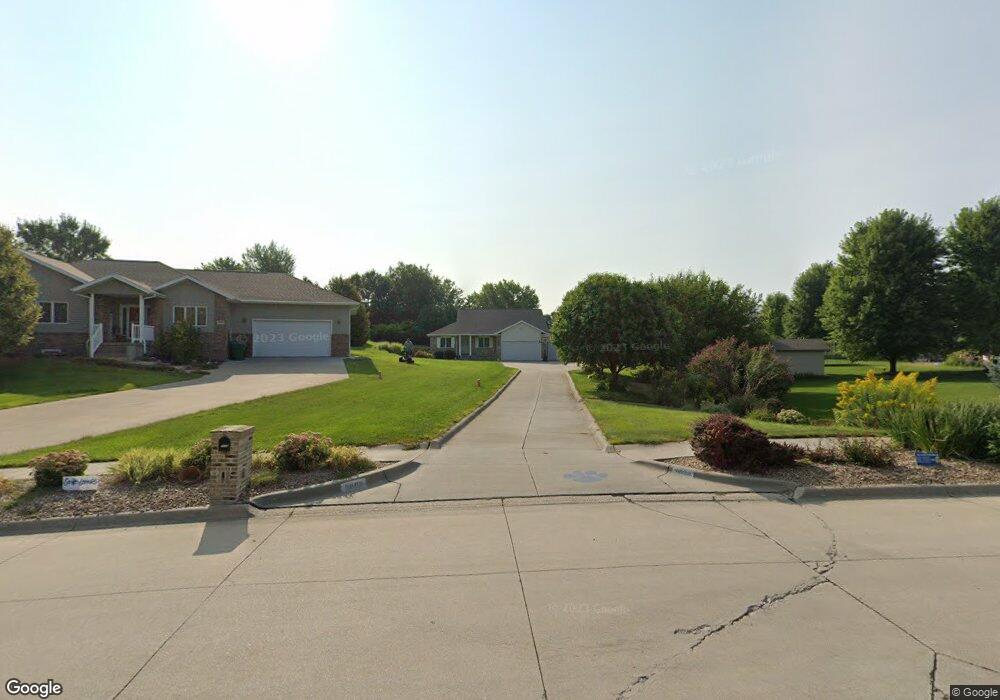
2008 W 42nd St Kearney, NE 68845
Estimated Value: $423,372 - $494,000
5
Beds
4
Baths
1,778
Sq Ft
$258/Sq Ft
Est. Value
About This Home
This home is located at 2008 W 42nd St, Kearney, NE 68845 and is currently estimated at $458,343, approximately $257 per square foot. 2008 W 42nd St is a home located in Buffalo County with nearby schools including Windy Hills Elementary School, Horizon Middle School, and Kearney Senior High School.
Ownership History
Date
Name
Owned For
Owner Type
Purchase Details
Closed on
Jan 24, 2019
Sold by
Bosshardt Carol S
Bought by
Goodwin Wade M and Goodwin Katherine L
Current Estimated Value
Home Financials for this Owner
Home Financials are based on the most recent Mortgage that was taken out on this home.
Original Mortgage
$294,500
Outstanding Balance
$258,397
Interest Rate
4.5%
Mortgage Type
New Conventional
Estimated Equity
$199,946
Purchase Details
Closed on
May 3, 2010
Sold by
Curry Relocation Company Llc
Bought by
Bosshardt Carol S
Home Financials for this Owner
Home Financials are based on the most recent Mortgage that was taken out on this home.
Original Mortgage
$250,000
Interest Rate
5.02%
Purchase Details
Closed on
Jun 13, 2008
Sold by
Kirkpatrick Richard D and Kirkpatrick Linda C
Bought by
Helgoth Kirk
Home Financials for this Owner
Home Financials are based on the most recent Mortgage that was taken out on this home.
Original Mortgage
$223,100
Interest Rate
6.07%
Purchase Details
Closed on
Jan 4, 2006
Sold by
Roeder Daniel P
Bought by
Kirkpatrick Richard D and Kirkpatrick Linda C
Home Financials for this Owner
Home Financials are based on the most recent Mortgage that was taken out on this home.
Original Mortgage
$229,900
Interest Rate
6.25%
Create a Home Valuation Report for This Property
The Home Valuation Report is an in-depth analysis detailing your home's value as well as a comparison with similar homes in the area
Home Values in the Area
Average Home Value in this Area
Purchase History
| Date | Buyer | Sale Price | Title Company |
|---|---|---|---|
| Goodwin Wade M | $310,000 | Tri City Title | |
| Bosshardt Carol S | $234,000 | Barney | |
| Helgoth Kirk | $230,000 | Barney | |
| Kirkpatrick Richard D | $229,900 | -- |
Source: Public Records
Mortgage History
| Date | Status | Borrower | Loan Amount |
|---|---|---|---|
| Open | Goodwin Wade M | $294,500 | |
| Previous Owner | Bosshardt Carol S | $250,000 | |
| Previous Owner | Helgoth Kirk | $223,100 | |
| Previous Owner | Kirkpatrick Richard D | $229,900 |
Source: Public Records
Tax History Compared to Growth
Tax History
| Year | Tax Paid | Tax Assessment Tax Assessment Total Assessment is a certain percentage of the fair market value that is determined by local assessors to be the total taxable value of land and additions on the property. | Land | Improvement |
|---|---|---|---|---|
| 2025 | $4,185 | $359,130 | $81,275 | $277,855 |
| 2024 | $4,185 | $327,880 | $78,910 | $248,970 |
| 2023 | $6,169 | $362,485 | $78,910 | $283,575 |
| 2022 | $5,972 | $340,325 | $81,490 | $258,835 |
| 2021 | $5,571 | $323,005 | $77,680 | $245,325 |
| 2020 | $5,546 | $320,615 | $77,680 | $242,935 |
| 2019 | $5,575 | $318,430 | $77,680 | $240,750 |
| 2018 | $5,109 | $296,000 | $71,905 | $224,095 |
| 2017 | $4,634 | $270,240 | $71,905 | $198,335 |
| 2016 | $4,593 | $270,125 | $71,905 | $198,220 |
| 2015 | $5,008 | $265,000 | $0 | $0 |
| 2014 | $5,008 | $262,685 | $0 | $0 |
Source: Public Records
Map
Nearby Homes
- TBD Country Club Ln Unit L10B2 Spruce Hollow
- L3B3 Country Club Ln
- L5B1 Aspen Meadows Second Addition
- TBD Lot 2 Block 4
- TBD Lot 11 Block 4
- TBD Lot 3 Block 2
- TBD Lot 2 Block 3
- TBD Lot 1 Block 3
- TBD Lt 2 Block 2
- TBD Lot 3 Block 3
- 2703 W 47th St
- TBD Lt 4 Block 3
- TBD Lot 1 Block 2
- TBD Lot 5 Block 3
- 6 21st Avenue Place
- 4423 Sunset Trail
- TBD 28th Ave Unit L5B1 Spruce Hollow W
- 3901-3903 Fairacres Rd
- Lot 4 Hawthorne Heights Unit (3.58AC)
- 4606 15th Avenue Place
- 2004 W 42nd St
- 4115 21st Avenue Place
- 4118 20th Ave
- 4114 20th Ave
- 4111 21st Avenue Place
- 4119 21st Avenue Place
- 4105 21st Avenue Place
- 4019 21st Avenue Place
- 4110 20th Ave
- 4015 21st Avenue Place
- 2007 W 42nd St
- 4116 21st Avenue Place
- 4112 21st Avenue Place
- 4106 20th Ave
- 4120 21st Avenue Place
- 4108 21st Avenue Place
- 2011 W 42nd St
- 4022 21st Avenue Place
- 4104 21st Avenue Place
- 4007 21st Avenue Place