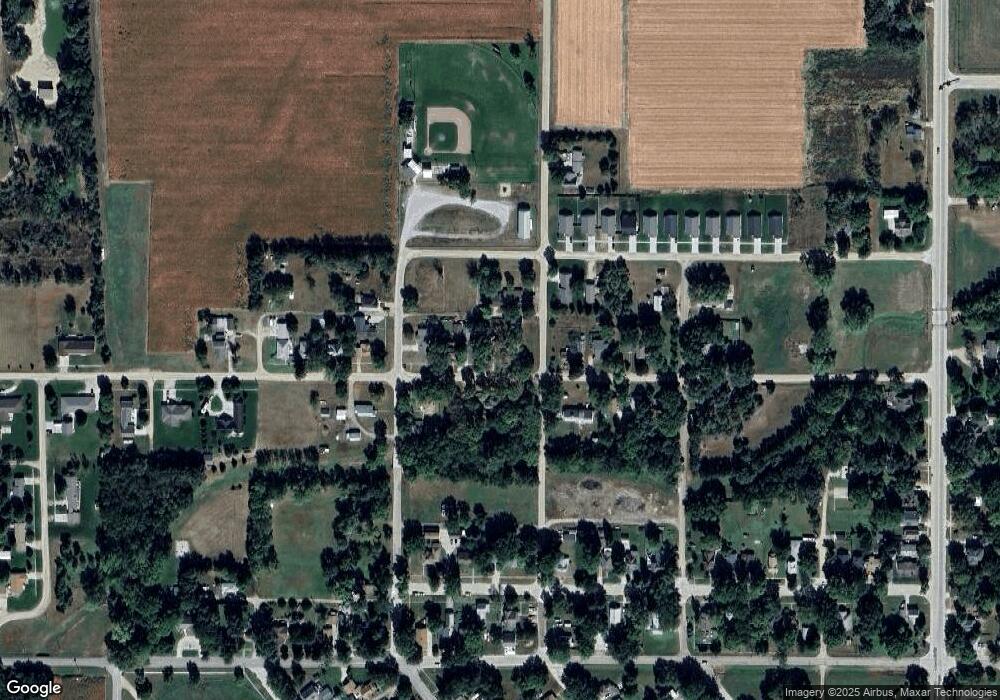
2009 11th St Central City, NE 68826
Estimated Value: $153,000 - $198,077
3
Beds
1
Bath
1,184
Sq Ft
$147/Sq Ft
Est. Value
About This Home
This home is located at 2009 11th St, Central City, NE 68826 and is currently estimated at $173,769, approximately $146 per square foot. 2009 11th St is a home located in Merrick County with nearby schools including Central City Elementary School, Central City Middle School, and Central City High School.
Ownership History
Date
Name
Owned For
Owner Type
Purchase Details
Closed on
Sep 13, 2011
Sold by
Gilson Linda L
Bought by
Kuhl Cherie E and Flinn Thomas L
Current Estimated Value
Purchase Details
Closed on
May 25, 2011
Sold by
Gilson Linda L and Gilson Linda
Bought by
Kuhl Cherie E and Flinn Thomas L
Home Financials for this Owner
Home Financials are based on the most recent Mortgage that was taken out on this home.
Original Mortgage
$43,767
Interest Rate
4.95%
Mortgage Type
New Conventional
Create a Home Valuation Report for This Property
The Home Valuation Report is an in-depth analysis detailing your home's value as well as a comparison with similar homes in the area
Home Values in the Area
Average Home Value in this Area
Purchase History
| Date | Buyer | Sale Price | Title Company |
|---|---|---|---|
| Kuhl Cherie E | -- | -- | |
| Kuhl Cherie E | $43,000 | None Available |
Source: Public Records
Mortgage History
| Date | Status | Borrower | Loan Amount |
|---|---|---|---|
| Previous Owner | Kuhl Cherie E | $43,767 |
Source: Public Records
Tax History Compared to Growth
Tax History
| Year | Tax Paid | Tax Assessment Tax Assessment Total Assessment is a certain percentage of the fair market value that is determined by local assessors to be the total taxable value of land and additions on the property. | Land | Improvement |
|---|---|---|---|---|
| 2025 | $1,844 | $162,325 | $40,985 | $121,340 |
| 2024 | $1,844 | $160,505 | $39,165 | $121,340 |
| 2023 | $2,045 | $141,380 | $20,040 | $121,340 |
| 2022 | $2,323 | $141,380 | $20,040 | $121,340 |
| 2021 | $2,028 | $117,130 | $20,040 | $97,090 |
| 2020 | $1,991 | $114,900 | $20,040 | $94,860 |
| 2019 | $1,793 | $104,520 | $9,660 | $94,860 |
| 2018 | $1,799 | $104,520 | $9,660 | $94,860 |
| 2017 | $1,389 | $80,265 | $9,660 | $70,605 |
| 2016 | $733 | $42,205 | $9,660 | $32,545 |
| 2015 | $788 | $42,205 | $9,660 | $32,545 |
| 2014 | $819 | $42,205 | $9,660 | $32,545 |
| 2012 | $464 | $44,225 | $9,660 | $34,565 |
Source: Public Records
Map
Nearby Homes