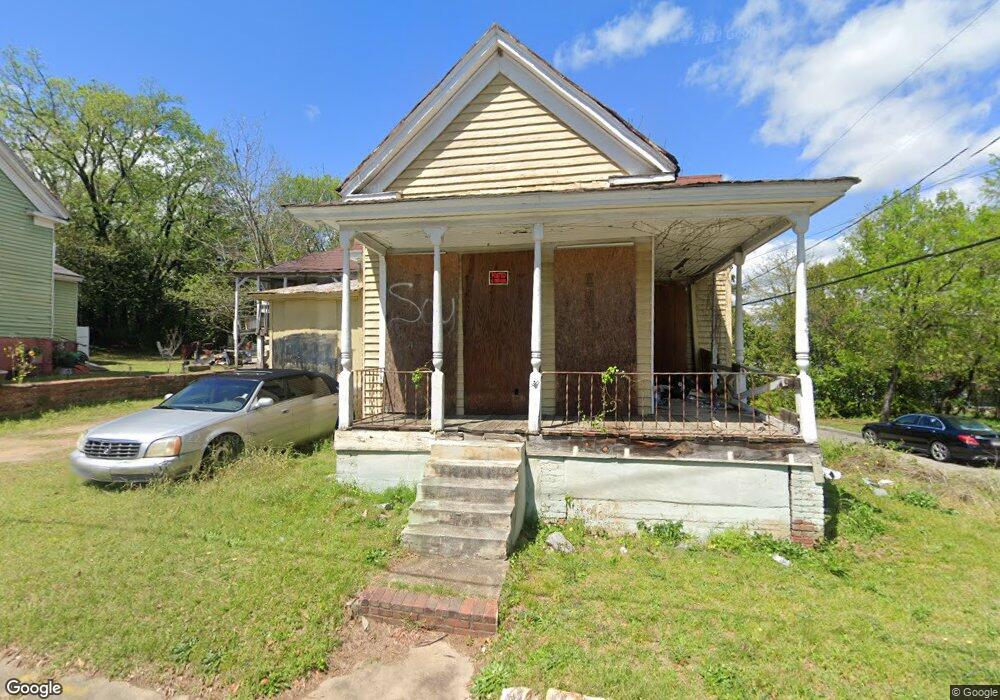
2009 3rd St Macon, GA 31201
Tindall Heights Historic District NeighborhoodEstimated Value: $47,000 - $61,000
2
Beds
1
Bath
1,015
Sq Ft
$51/Sq Ft
Est. Value
About This Home
This home is located at 2009 3rd St, Macon, GA 31201 and is currently estimated at $52,152, approximately $51 per square foot. 2009 3rd St is a home located in Bibb County with nearby schools including Ingram-Pye Elementary School, Central High School, and Cirrus Charter Academy.
Ownership History
Date
Name
Owned For
Owner Type
Purchase Details
Closed on
Mar 11, 2021
Sold by
Gibson Ashawna Lakeyia
Bought by
Whaley Charlie James
Current Estimated Value
Purchase Details
Closed on
Sep 25, 2014
Sold by
Whaley Charles James
Bought by
Gibson Ashawna Lakeyia
Purchase Details
Closed on
Jun 12, 2006
Bought by
Whaley Charles
Home Financials for this Owner
Home Financials are based on the most recent Mortgage that was taken out on this home.
Original Mortgage
$11,565
Interest Rate
6.49%
Mortgage Type
Purchase Money Mortgage
Purchase Details
Closed on
Dec 21, 2005
Sold by
Adside Wallace
Bought by
Cooper Shawn L
Create a Home Valuation Report for This Property
The Home Valuation Report is an in-depth analysis detailing your home's value as well as a comparison with similar homes in the area
Home Values in the Area
Average Home Value in this Area
Purchase History
| Date | Buyer | Sale Price | Title Company |
|---|---|---|---|
| Whaley Charlie James | -- | None Available | |
| Gibson Ashawna Lakeyia | -- | None Available | |
| Whaley Charles | $11,600 | -- | |
| Cooper Shawn L | -- | Na |
Source: Public Records
Mortgage History
| Date | Status | Borrower | Loan Amount |
|---|---|---|---|
| Previous Owner | Whaley Charles | $11,565 |
Source: Public Records
Tax History
| Year | Tax Paid | Tax Assessment Tax Assessment Total Assessment is a certain percentage of the fair market value that is determined by local assessors to be the total taxable value of land and additions on the property. | Land | Improvement |
|---|---|---|---|---|
| 2025 | $149 | $6,074 | $1,300 | $4,774 |
| 2024 | $154 | $6,060 | $1,300 | $4,760 |
| 2023 | $154 | $6,060 | $1,300 | $4,760 |
| 2022 | $242 | $6,977 | $4,162 | $2,815 |
| 2021 | $261 | $6,869 | $4,162 | $2,707 |
| 2020 | $267 | $6,869 | $4,162 | $2,707 |
| 2019 | $269 | $6,869 | $4,162 | $2,707 |
| 2018 | $1,245 | $14,765 | $4,162 | $10,603 |
| 2017 | $553 | $14,765 | $4,162 | $10,603 |
| 2016 | $511 | $14,765 | $4,162 | $10,603 |
| 2015 | $723 | $14,765 | $4,162 | $10,603 |
| 2014 | $832 | $14,765 | $4,162 | $10,603 |
Source: Public Records
Map
Nearby Homes
- 727 S Williams St
- 2426 2nd St
- 672 Bowden St
- 645 Ell St
- 2221 Knott Street Ln
- 510 Edgewood Ave
- 836 Plant St
- 871 Tenney Ave
- 553 & 565 Edgewood Ave
- 553 Edgewood Ave
- 1425 3rd St
- 791 Liberty St
- 2503 Felton Ave
- 806 Armory Dr
- 1405 2nd St
- 548 Colquitt St
- 1590 Telfair St
- 579 Charles St
- 358 Pittman St
- 2476 Felton Ave
Your Personal Tour Guide
Ask me questions while you tour the home.