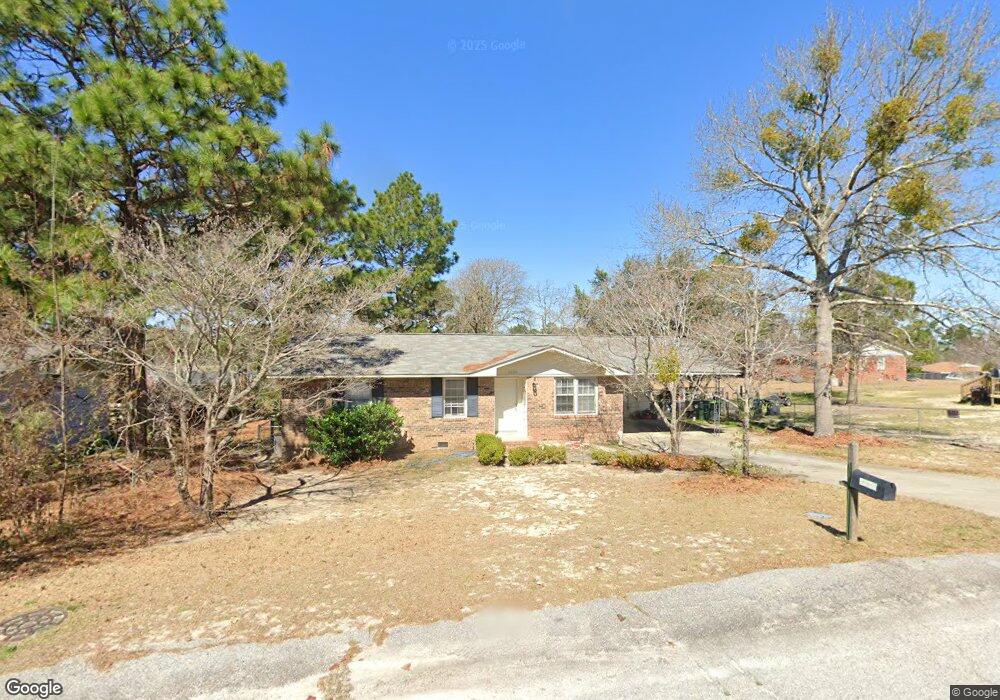
2009 Capitol View Rd Gaston, SC 29053
Pine Ridge NeighborhoodEstimated Value: $118,000 - $155,479
3
Beds
1
Bath
1,013
Sq Ft
$143/Sq Ft
Est. Value
About This Home
This home is located at 2009 Capitol View Rd, Gaston, SC 29053 and is currently estimated at $144,620, approximately $142 per square foot. 2009 Capitol View Rd is a home located in Lexington County with nearby schools including Herbert A. Wood Elementary School, Pine Ridge Middle School, and Airport High School.
Ownership History
Date
Name
Owned For
Owner Type
Purchase Details
Closed on
Feb 8, 2011
Sold by
Federal National Mortgage Association
Bought by
Front Page Properties Llc
Current Estimated Value
Purchase Details
Closed on
Nov 17, 2010
Sold by
Boyle Ann W
Bought by
Federal National Mortgage Association
Purchase Details
Closed on
Jun 28, 2007
Sold by
Hartless Kurt
Bought by
Boyle Russell O and Boyle Ann W
Home Financials for this Owner
Home Financials are based on the most recent Mortgage that was taken out on this home.
Original Mortgage
$74,000
Interest Rate
6.37%
Mortgage Type
Purchase Money Mortgage
Purchase Details
Closed on
Oct 23, 2006
Sold by
Odom Sandra
Bought by
Hartless Lynn
Create a Home Valuation Report for This Property
The Home Valuation Report is an in-depth analysis detailing your home's value as well as a comparison with similar homes in the area
Home Values in the Area
Average Home Value in this Area
Purchase History
| Date | Buyer | Sale Price | Title Company |
|---|---|---|---|
| Front Page Properties Llc | $35,000 | -- | |
| Federal National Mortgage Association | $2,500 | -- | |
| Boyle Russell O | $74,000 | Attorney | |
| Hartless Lynn | $46,000 | None Available |
Source: Public Records
Mortgage History
| Date | Status | Borrower | Loan Amount |
|---|---|---|---|
| Previous Owner | Boyle Russell O | $74,000 |
Source: Public Records
Tax History
| Year | Tax Paid | Tax Assessment Tax Assessment Total Assessment is a certain percentage of the fair market value that is determined by local assessors to be the total taxable value of land and additions on the property. | Land | Improvement |
|---|---|---|---|---|
| 2024 | $1,247 | $3,358 | $540 | $2,818 |
| 2023 | $1,160 | $3,358 | $540 | $2,818 |
| 2022 | $1,084 | $3,358 | $540 | $2,818 |
| 2020 | $1,042 | $3,358 | $540 | $2,818 |
| 2019 | $945 | $3,024 | $540 | $2,484 |
| 2018 | $936 | $3,024 | $540 | $2,484 |
| 2017 | $923 | $3,024 | $540 | $2,484 |
| 2016 | $931 | $3,024 | $540 | $2,484 |
| 2014 | $1,161 | $4,435 | $540 | $3,895 |
| 2013 | -- | $4,440 | $540 | $3,900 |
Source: Public Records
Map
Nearby Homes
- 1916 Capitol View Rd
- 3104 Bachman Rd
- 2105 Sandy Run Dr
- 2108 Oak Top Dr
- 161 Arrowpoint Dr
- 2128 Glenn Rd
- 113 Black Oak Rd
- 1973 Glenn Rd
- 627 Richmond Rd
- 720 Glider Dr
- 631 Richmond Rd
- 605 Richmond Rd
- 723 Glider Dr
- 617 Richmond Rd
- 600 Richmond Rd
- 212 Calcutta Dr
- 608 Richmond Rd
- 204 Calcutta Dr
- 545 Richmond Rd
- 719 Glider Dr
- 2013 Capitol View Rd
- 301 Dixiana Dr
- 305 Dixiana Dr
- 2008 Sandy Run Dr
- 2017 Capitol View Rd
- 2012 Sandy Run Dr
- 309 Dixiana Dr
- 2012 Capitol View Rd
- 229 Dixiana Dr
- 2016 Sandy Run Dr
- 2021 Capitol View Rd
- 1917 Capitol View Rd
- 2020 Capitol View Rd
- 225 Dixiana Dr
- 304 Dixiana Dr
- 2016 Capitol View Rd
- 2009 Sandy Run Dr
- 1920 Sandy Run Dr
- 1920 Capitol View Rd
- 2025 Capitol View Rd
Your Personal Tour Guide
Ask me questions while you tour the home.