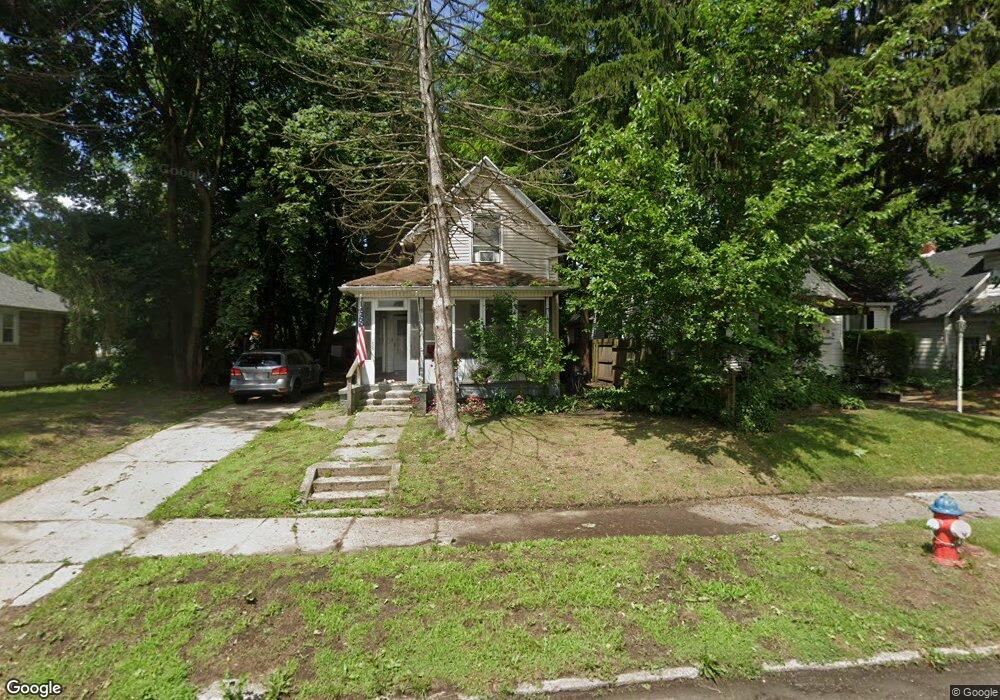
2009 Catalpa Ave South Bend, IN 46613
Rum Village NeighborhoodEstimated Value: $88,000 - $149,000
3
Beds
1
Bath
1,272
Sq Ft
$88/Sq Ft
Est. Value
About This Home
This home is located at 2009 Catalpa Ave, South Bend, IN 46613 and is currently estimated at $112,282, approximately $88 per square foot. 2009 Catalpa Ave is a home located in St. Joseph County with nearby schools including Marshall Traditional School, Clay Intermediate Center, and Monroe Elementary School.
Ownership History
Date
Name
Owned For
Owner Type
Purchase Details
Closed on
Mar 16, 2010
Sold by
Yerushalmi Alon and Lewis Thomas F
Bought by
Yerushalmi Alon and Yerushalmi Neta
Current Estimated Value
Purchase Details
Closed on
Nov 25, 2009
Sold by
Homeworks Funding Group Llc
Bought by
Barak Group Llc
Purchase Details
Closed on
Nov 6, 2009
Sold by
Communitywide Federal Credit Union
Bought by
Homeworks Funding Group Llc
Purchase Details
Closed on
Apr 10, 2009
Sold by
Helenburg Linda J and Ewald Daniel T
Bought by
Communitywde Federal Credit Union
Create a Home Valuation Report for This Property
The Home Valuation Report is an in-depth analysis detailing your home's value as well as a comparison with similar homes in the area
Home Values in the Area
Average Home Value in this Area
Purchase History
| Date | Buyer | Sale Price | Title Company |
|---|---|---|---|
| Yerushalmi Alon | -- | Lawyers Title | |
| Yerushalmi Alon | -- | Lawyers Title | |
| Barak Group Llc | -- | None Available | |
| Homeworks Funding Group Llc | -- | Metropolitan Title In Llc | |
| Communitywde Federal Credit Union | -- | None Available |
Source: Public Records
Tax History Compared to Growth
Tax History
| Year | Tax Paid | Tax Assessment Tax Assessment Total Assessment is a certain percentage of the fair market value that is determined by local assessors to be the total taxable value of land and additions on the property. | Land | Improvement |
|---|---|---|---|---|
| 2024 | $1,102 | $44,300 | $6,600 | $37,700 |
| 2023 | $1,065 | $44,400 | $6,600 | $37,800 |
| 2022 | $1,065 | $44,400 | $6,600 | $37,800 |
| 2021 | $924 | $36,700 | $2,300 | $34,400 |
| 2020 | $924 | $36,700 | $2,300 | $34,400 |
| 2019 | $837 | $39,700 | $2,500 | $37,200 |
| 2018 | $991 | $39,700 | $2,500 | $37,200 |
| 2017 | $1,024 | $39,400 | $2,500 | $36,900 |
| 2016 | $1,046 | $39,400 | $2,500 | $36,900 |
| 2014 | $1,009 | $38,600 | $2,500 | $36,100 |
Source: Public Records
Map
Nearby Homes
- 2009 Catalpa St
- 726 W Calvert St
- 2213 Kendall St
- PRAIRIE AVE. (Sr 23 ) and Indiana Ave
- 1819 S Scott St
- 1723 Kendall St
- 1722 Kendall St
- 1637 Kemble Ave
- 2126 S Taylor St
- 1631 S Scott St
- 2022 Swygart Ave
- 1202 W Indiana Ave
- 610 W Indiana Ave
- 1317 W Indiana Ave
- 1413 W Indiana Ave
- 1722 Nash St
- 1601 Magnolia St
- 2005 Prairie Ave
- 122 E Indiana Ave
- 1921 W Ewing Ave
- 2013 Catalpa Ave
- 2005 Catalpa Ave
- 2019 Catalpa Ave
- 2003 Catalpa Ave
- 2021 Catalpa Ave
- 2012 Kemble Ave
- 2010 Kemble Ave
- 2014 Kemble Ave
- 2006 Kemble Ave
- 2016 Kemble Ave
- 1921 Catalpa St
- 2010 Catalpa Ave
- 2018 Catalpa St
- 2014 Catalpa Ave
- 2008 Catalpa Ave
- 2020 Kemble Ave
- 2018 Catalpa Ave
- 2002 Kemble Ave
- 1922 Kemble Ave
- 2002 Catalpa Ave