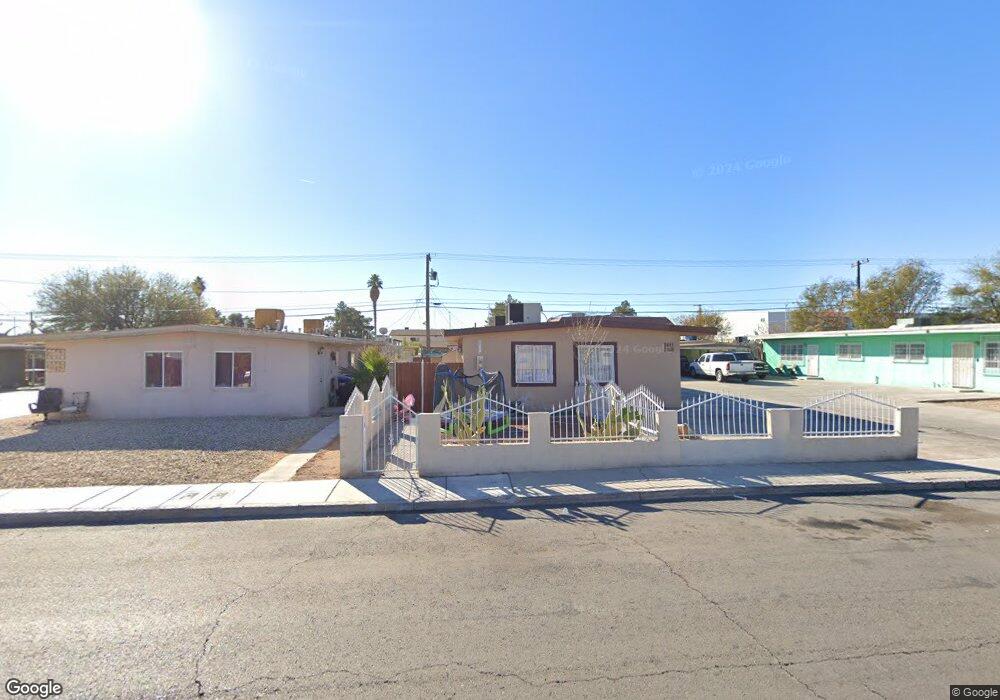
2009 E Webb Ave North Las Vegas, NV 89030
Downtown North Las Vegas NeighborhoodEstimated Value: $334,000 - $377,000
5
Beds
3
Baths
1,649
Sq Ft
$214/Sq Ft
Est. Value
About This Home
This home is located at 2009 E Webb Ave, North Las Vegas, NV 89030 and is currently estimated at $352,236, approximately $213 per square foot. 2009 E Webb Ave is a home located in Clark County with nearby schools including C.P. Squires Elementary School, J.D. Smith Middle School, and Rancho High School.
Ownership History
Date
Name
Owned For
Owner Type
Purchase Details
Closed on
May 30, 2001
Sold by
Reyes Sergio and Reyes Maribel Chacon
Bought by
Sanchez Roberto
Current Estimated Value
Home Financials for this Owner
Home Financials are based on the most recent Mortgage that was taken out on this home.
Original Mortgage
$111,008
Outstanding Balance
$42,316
Interest Rate
7.15%
Mortgage Type
FHA
Estimated Equity
$309,920
Purchase Details
Closed on
Feb 24, 1995
Sold by
Cummings Bernice and Cummings Eugene
Bought by
Casa Mex Inc
Purchase Details
Closed on
Feb 16, 1993
Sold by
Casa Mex Inc
Bought by
Reyes Sergio and Chacon Mayra Maribel
Home Financials for this Owner
Home Financials are based on the most recent Mortgage that was taken out on this home.
Original Mortgage
$69,364
Interest Rate
9.03%
Mortgage Type
FHA
Create a Home Valuation Report for This Property
The Home Valuation Report is an in-depth analysis detailing your home's value as well as a comparison with similar homes in the area
Home Values in the Area
Average Home Value in this Area
Purchase History
| Date | Buyer | Sale Price | Title Company |
|---|---|---|---|
| Sanchez Roberto | $112,000 | First American Title Co | |
| Casa Mex Inc | $23,500 | Land Title | |
| Casa Mex Inc | $23,500 | Land Title | |
| Reyes Sergio | $69,500 | Land Title |
Source: Public Records
Mortgage History
| Date | Status | Borrower | Loan Amount |
|---|---|---|---|
| Open | Sanchez Roberto | $111,008 | |
| Previous Owner | Reyes Sergio | $69,364 |
Source: Public Records
Tax History Compared to Growth
Tax History
| Year | Tax Paid | Tax Assessment Tax Assessment Total Assessment is a certain percentage of the fair market value that is determined by local assessors to be the total taxable value of land and additions on the property. | Land | Improvement |
|---|---|---|---|---|
| 2025 | $831 | $48,053 | $28,700 | $19,353 |
| 2024 | $770 | $48,053 | $28,700 | $19,353 |
| 2023 | $770 | $44,441 | $27,650 | $16,791 |
| 2022 | $713 | $38,671 | $23,100 | $15,571 |
| 2021 | $660 | $32,464 | $20,300 | $12,164 |
| 2020 | $610 | $31,003 | $18,550 | $12,453 |
| 2019 | $572 | $26,076 | $14,000 | $12,076 |
| 2018 | $546 | $23,501 | $12,250 | $11,251 |
| 2017 | $782 | $23,300 | $12,250 | $11,050 |
| 2016 | $512 | $19,543 | $8,750 | $10,793 |
| 2015 | $510 | $17,426 | $7,000 | $10,426 |
| 2014 | $494 | $15,590 | $4,200 | $11,390 |
Source: Public Records
Map
Nearby Homes
- 0 E Reynolds Ave
- 1313 N 23rd St
- 2315 Perliter Ave
- 1615 Flower Ave
- 1819 N Bruce St
- 2621 E Tonopah Ave
- 2005 Jansen Ave
- 1203 Mews Ln
- 1226 Coach Ln
- 2746 E Owens Ave
- 1311 Flower Ave
- 2624 Brady Ave Unit 1
- 1812 Roosevelt St
- 2801 Emmons Ave
- 1705 Leslie Ave Unit 1
- 1413 Melissa St
- 2825 Hickey Ave
- 833 N Bruce St
- 1413 N Mojave Rd
- 1736 Statz St
- 2013 E Webb Ave
- 2005 E Webb Ave
- 2008 E Owens Ave
- 2017 E Webb Ave
- 2001 E Webb Ave
- 2012 E Owens Ave
- 2004 E Owens Ave
- 2000 E Owens Ave
- 2016 E Owens Ave
- 2010 E Webb Ave
- 2012 E Webb Ave
- 2004 E Webb Ave
- 2021 E Webb Ave
- 2016 E Webb Ave
- 2000 E Webb Ave
- 2020 E Owens Ave
- 2101 E Webb Ave
- 2020 E Webb Ave
- 1816 E Owens Ave