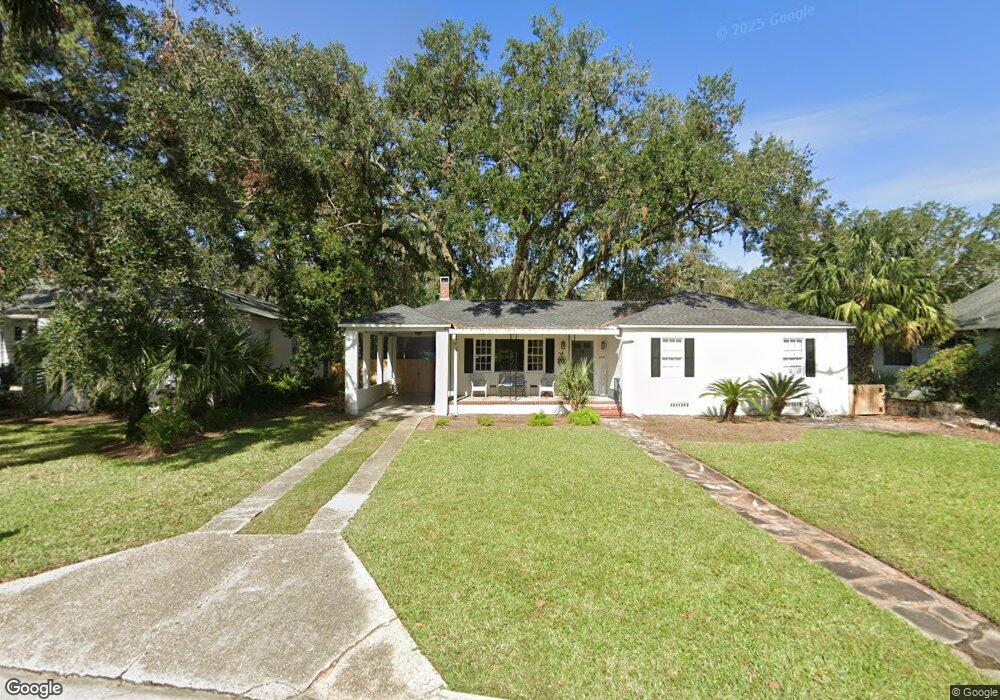
2009 Elm Cir Brunswick, GA 31520
Estimated Value: $331,000 - $365,356
3
Beds
1
Bath
1,200
Sq Ft
$291/Sq Ft
Est. Value
About This Home
This home is located at 2009 Elm Cir, Brunswick, GA 31520 and is currently estimated at $349,089, approximately $290 per square foot. 2009 Elm Cir is a home located in Glynn County with nearby schools including St. Simons Elementary School, Glynn Middle School, and Glynn Academy.
Ownership History
Date
Name
Owned For
Owner Type
Purchase Details
Closed on
May 6, 2024
Sold by
Jasnick Enterprises Llc
Bought by
Torres Arlene and Torres Humberto Vera
Current Estimated Value
Home Financials for this Owner
Home Financials are based on the most recent Mortgage that was taken out on this home.
Original Mortgage
$236,250
Outstanding Balance
$232,459
Interest Rate
6.82%
Mortgage Type
New Conventional
Estimated Equity
$116,630
Purchase Details
Closed on
Aug 20, 2021
Sold by
Nickole Mitchell
Bought by
Nb Mitchell Family Llc
Home Financials for this Owner
Home Financials are based on the most recent Mortgage that was taken out on this home.
Original Mortgage
$200,000
Interest Rate
2.9%
Mortgage Type
New Conventional
Purchase Details
Closed on
Aug 9, 2021
Sold by
Tucker Cyle A
Bought by
Mitchell Nickole
Home Financials for this Owner
Home Financials are based on the most recent Mortgage that was taken out on this home.
Original Mortgage
$200,000
Interest Rate
2.9%
Mortgage Type
New Conventional
Create a Home Valuation Report for This Property
The Home Valuation Report is an in-depth analysis detailing your home's value as well as a comparison with similar homes in the area
Home Values in the Area
Average Home Value in this Area
Purchase History
| Date | Buyer | Sale Price | Title Company |
|---|---|---|---|
| Torres Arlene | $315,000 | -- | |
| Nb Mitchell Family Llc | -- | -- | |
| Mitchell Nickole | $250,000 | -- |
Source: Public Records
Mortgage History
| Date | Status | Borrower | Loan Amount |
|---|---|---|---|
| Open | Torres Arlene | $236,250 | |
| Previous Owner | Mitchell Nickole | $200,000 |
Source: Public Records
Tax History Compared to Growth
Tax History
| Year | Tax Paid | Tax Assessment Tax Assessment Total Assessment is a certain percentage of the fair market value that is determined by local assessors to be the total taxable value of land and additions on the property. | Land | Improvement |
|---|---|---|---|---|
| 2025 | $2,410 | $114,640 | $23,320 | $91,320 |
| 2024 | $2,774 | $131,960 | $23,320 | $108,640 |
| 2023 | $3,694 | $98,560 | $15,560 | $83,000 |
| 2022 | $3,024 | $77,800 | $7,760 | $70,040 |
| 2021 | $2,035 | $71,640 | $7,760 | $63,880 |
| 2020 | $1,935 | $63,120 | $7,760 | $55,360 |
| 2019 | $780 | $63,120 | $7,760 | $55,360 |
| 2018 | $786 | $41,840 | $7,760 | $34,080 |
| 2017 | $1,654 | $46,080 | $7,760 | $38,320 |
| 2016 | $1,461 | $40,280 | $6,200 | $34,080 |
| 2015 | $1,399 | $36,000 | $6,200 | $29,800 |
| 2014 | $1,399 | $36,000 | $6,200 | $29,800 |
Source: Public Records
Map
Nearby Homes
- 1425 Lanier Blvd
- 2106 Gloucester St
- 1525 Tillman Ave
- 920 Johnston St
- 1621 Lee St
- 900 Lanier Blvd Unit 6
- 1308 George St
- 917 Amherst St
- 1709 Amherst St
- 911 Amherst St
- 1410 Prince St
- 1408 Prince St
- 1409 Egmont St
- 816 Amherst St
- 716 Gordon St
- 912 Carpenter St
- 1208 Union St
- 0 Cherry St
- 3641 U S Highway 82
- 1303 Union St
- 2009 Elm Ave
- 2011 Elm Ave
- 2007 Elm Ave
- 1302 Sycamore Ave
- 1313 Palmetto Ave
- 1314 Sycamore Ave
- 1318 Sycamore Ave
- 2201 Elm Ave
- 1310 Palmetto Ave
- 1329 Palmetto Ave
- 1312 Palmetto Ave
- 1244 Palmetto Ave
- 2104 Holly Ave
- 1240 Palmetto Ave
- 1225 Sycamore Ave
- 1309 Sycamore Ave
- 1234 Palmetto Ave
- 1400 Sycamore Ave
- 1223 Sycamore Ave
- 1329 Sycamore Ave